Postings on science, wine, and the mind, among other things.
Family-wise power
Multiple comparisons are even worse than you thought!
Most scientists who routinely work with statistics are familiar with the problem of multiple comparisons. To quote an earlier piece of mine on the topic:
"The traditional null hypothesis significance testing framework is vulnerable to testing multiple hypotheses at the same time. Under ordinary circumstances, setting one's threshold to the customary α = .05 (meaning that p-values must be less than .05 to be "statistically significant") should fix the chance of a type I error (false rejection of null hypothesis) to 5%, assuming the assumptions of the test in question are met. [...] However, in the frequentist framework this error risk refers to a (usually imaginary) series of tests of a single hypothesis. If one simultaneously tests multiple hypotheses at once, one's risk of incorrectly rejecting at least one null hypothesis increases accordingly. The risk of falsely rejecting at least one hypothesis in a set is known as the family-wise error (FWE) rate."
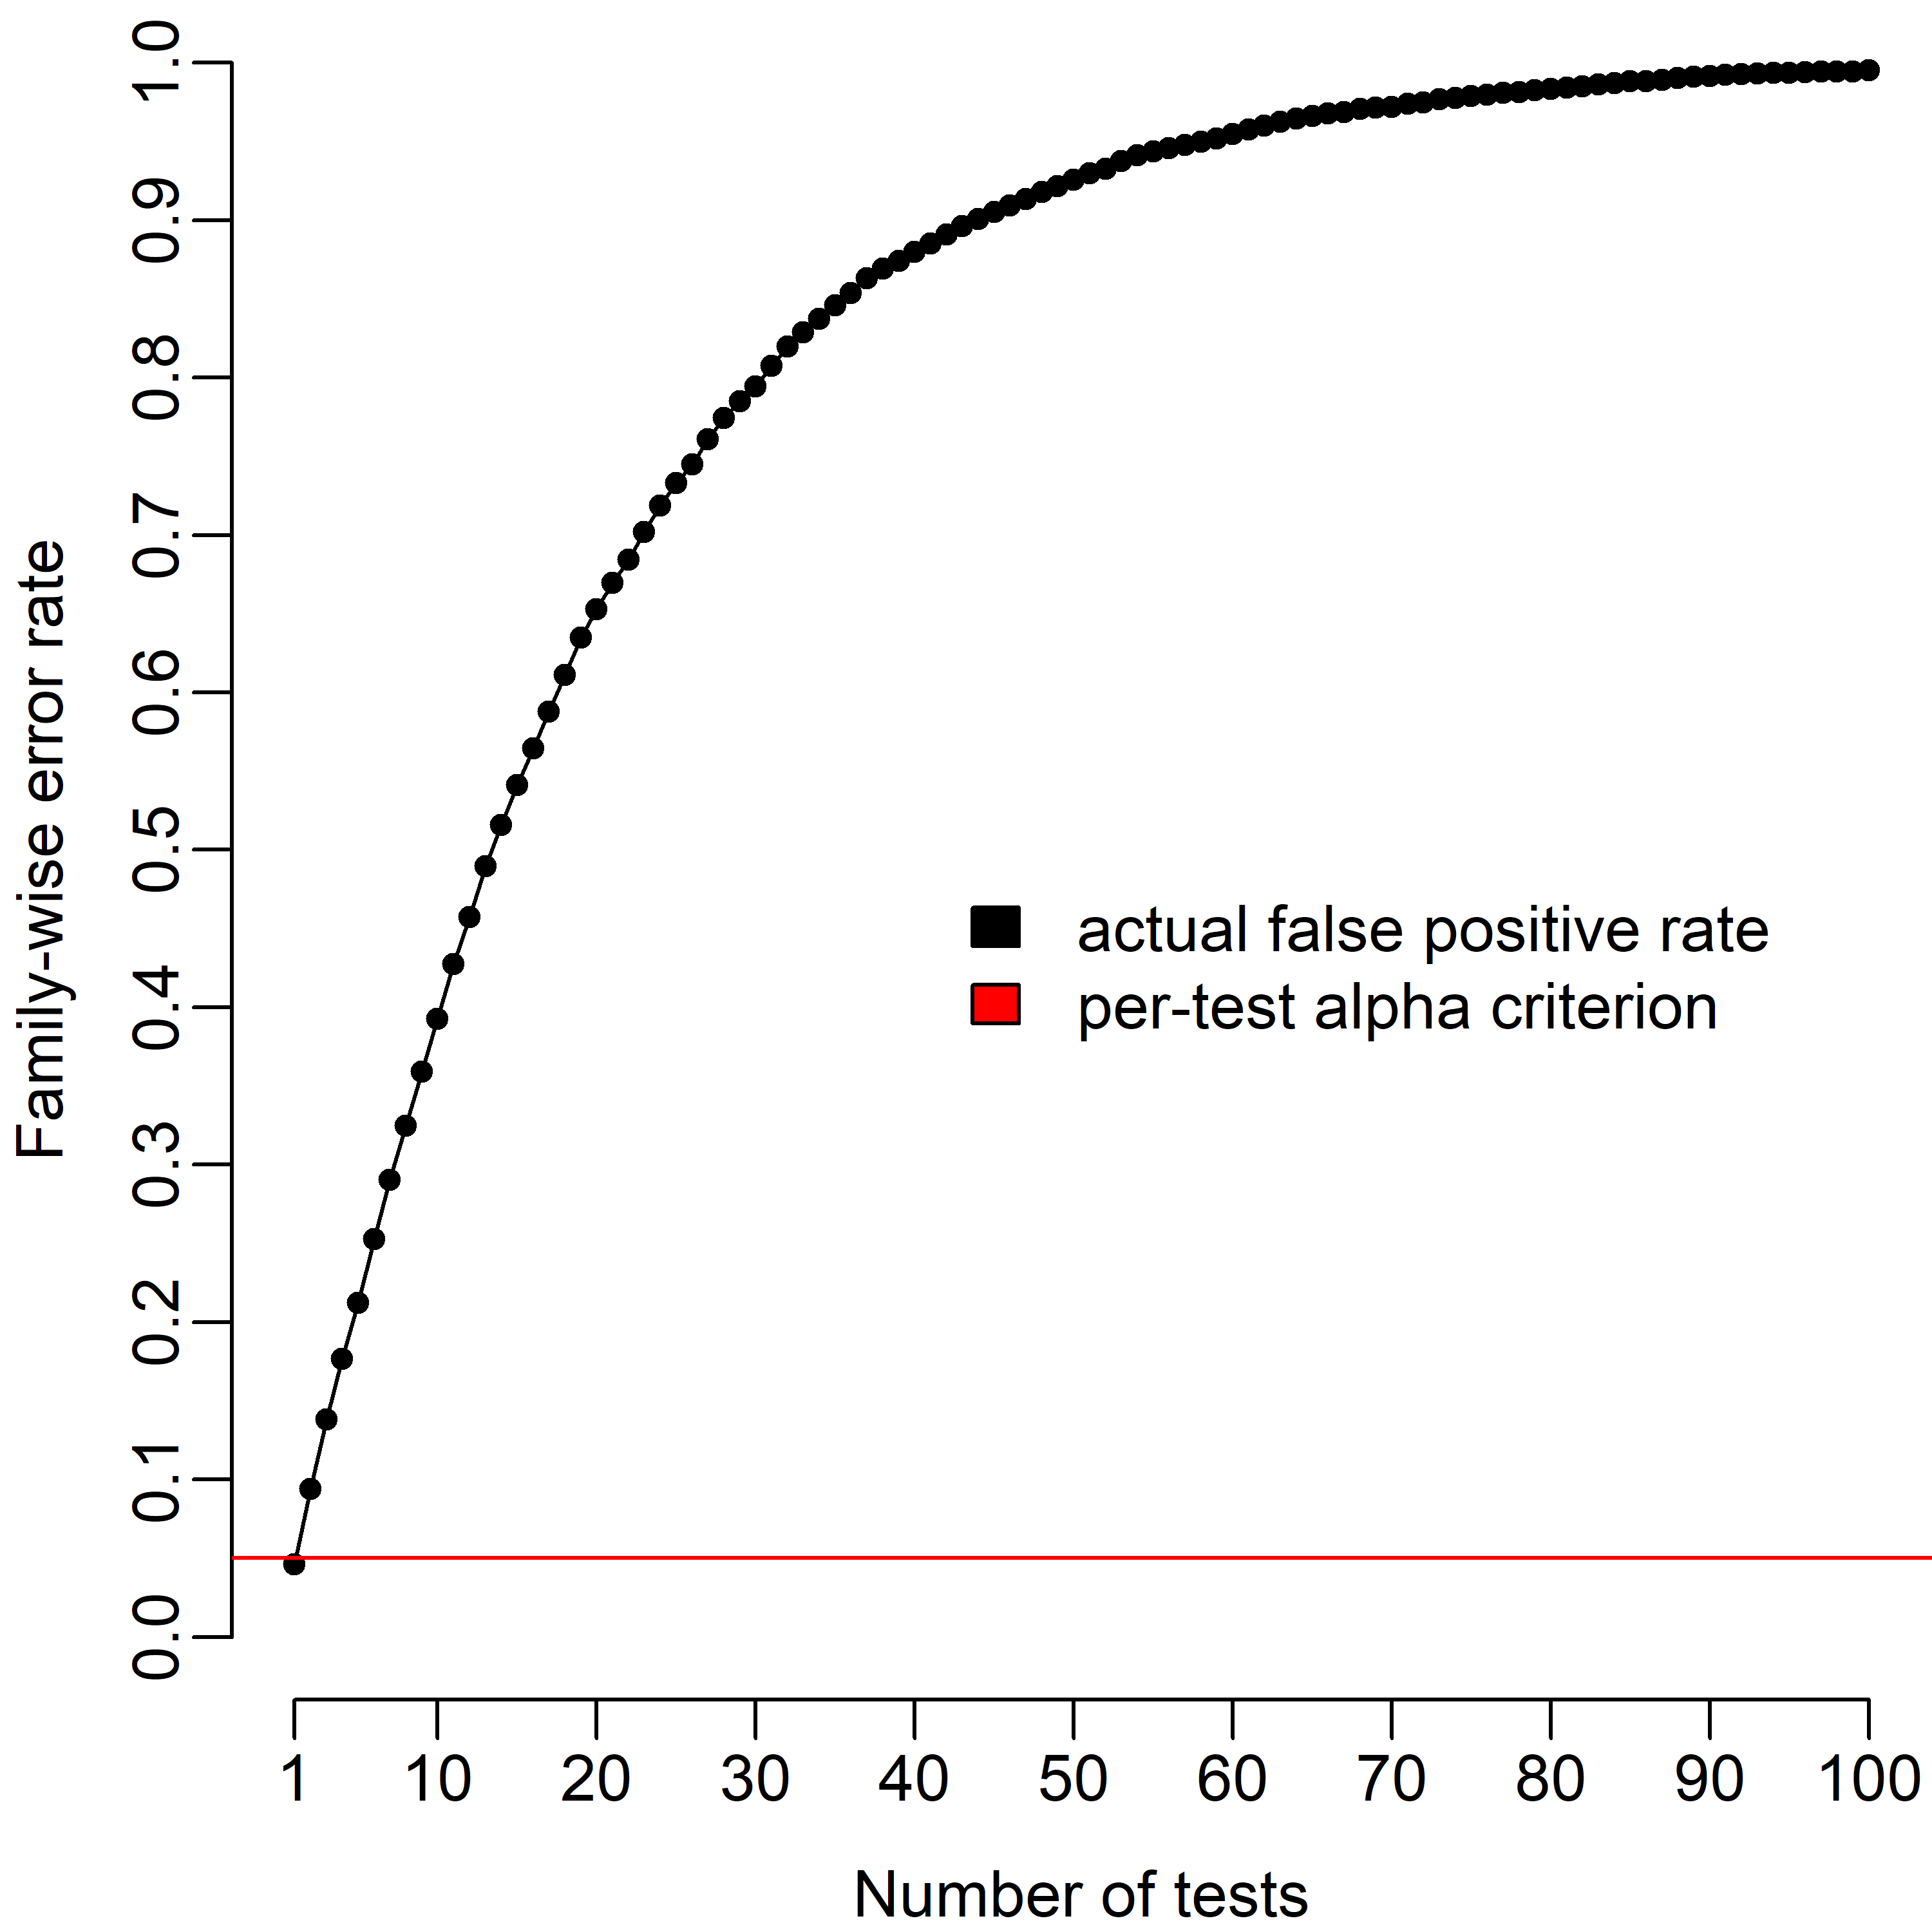
This problem is illustrated in the figure below. As the number of tests grows, so too does the risk of a least one false positive in the set. (Here and for all other graphs/simulations in this article, I assume the simplest possible case of one-sample t-tests on independent, normally distributed data. Things get more complicated in a whole variety of ways as these assumptions are relaxed, but that's beyond the scope of this post.)
However, the risk of a false positive is only one side of the equation. One must also consider the risk of a false negative: failing to reject a null hypothesis that is actually false. Just as the false positive risk threshold is denoted by α, the false negative risk threshold is defined by β. However, for conventional reasons, the "gold standard" β = .20. This implicitly suggests that a false negative is more acceptable than a false positive, which may be true in some circumstances, but is assuredly not a law of nature. Moreover, in practice, many studies are drastically underpowered, and fail to approach even the relatively liberal 80% power (1-β) convention.
Unfortunately, the multiple comparison problem doesn't just affect false positives - it also impacts false negatives. Just as one can think about FWE for false positives, one might also contemplate a family-wise power (FWP) rate: the risk of falsely failing to reject the null in at least one of a set of tests. In the graph below, you can see how FWP changes as a function of test number. Here we set the global effect size to d = .5 (a "medium" effect by the old rule of thumb).
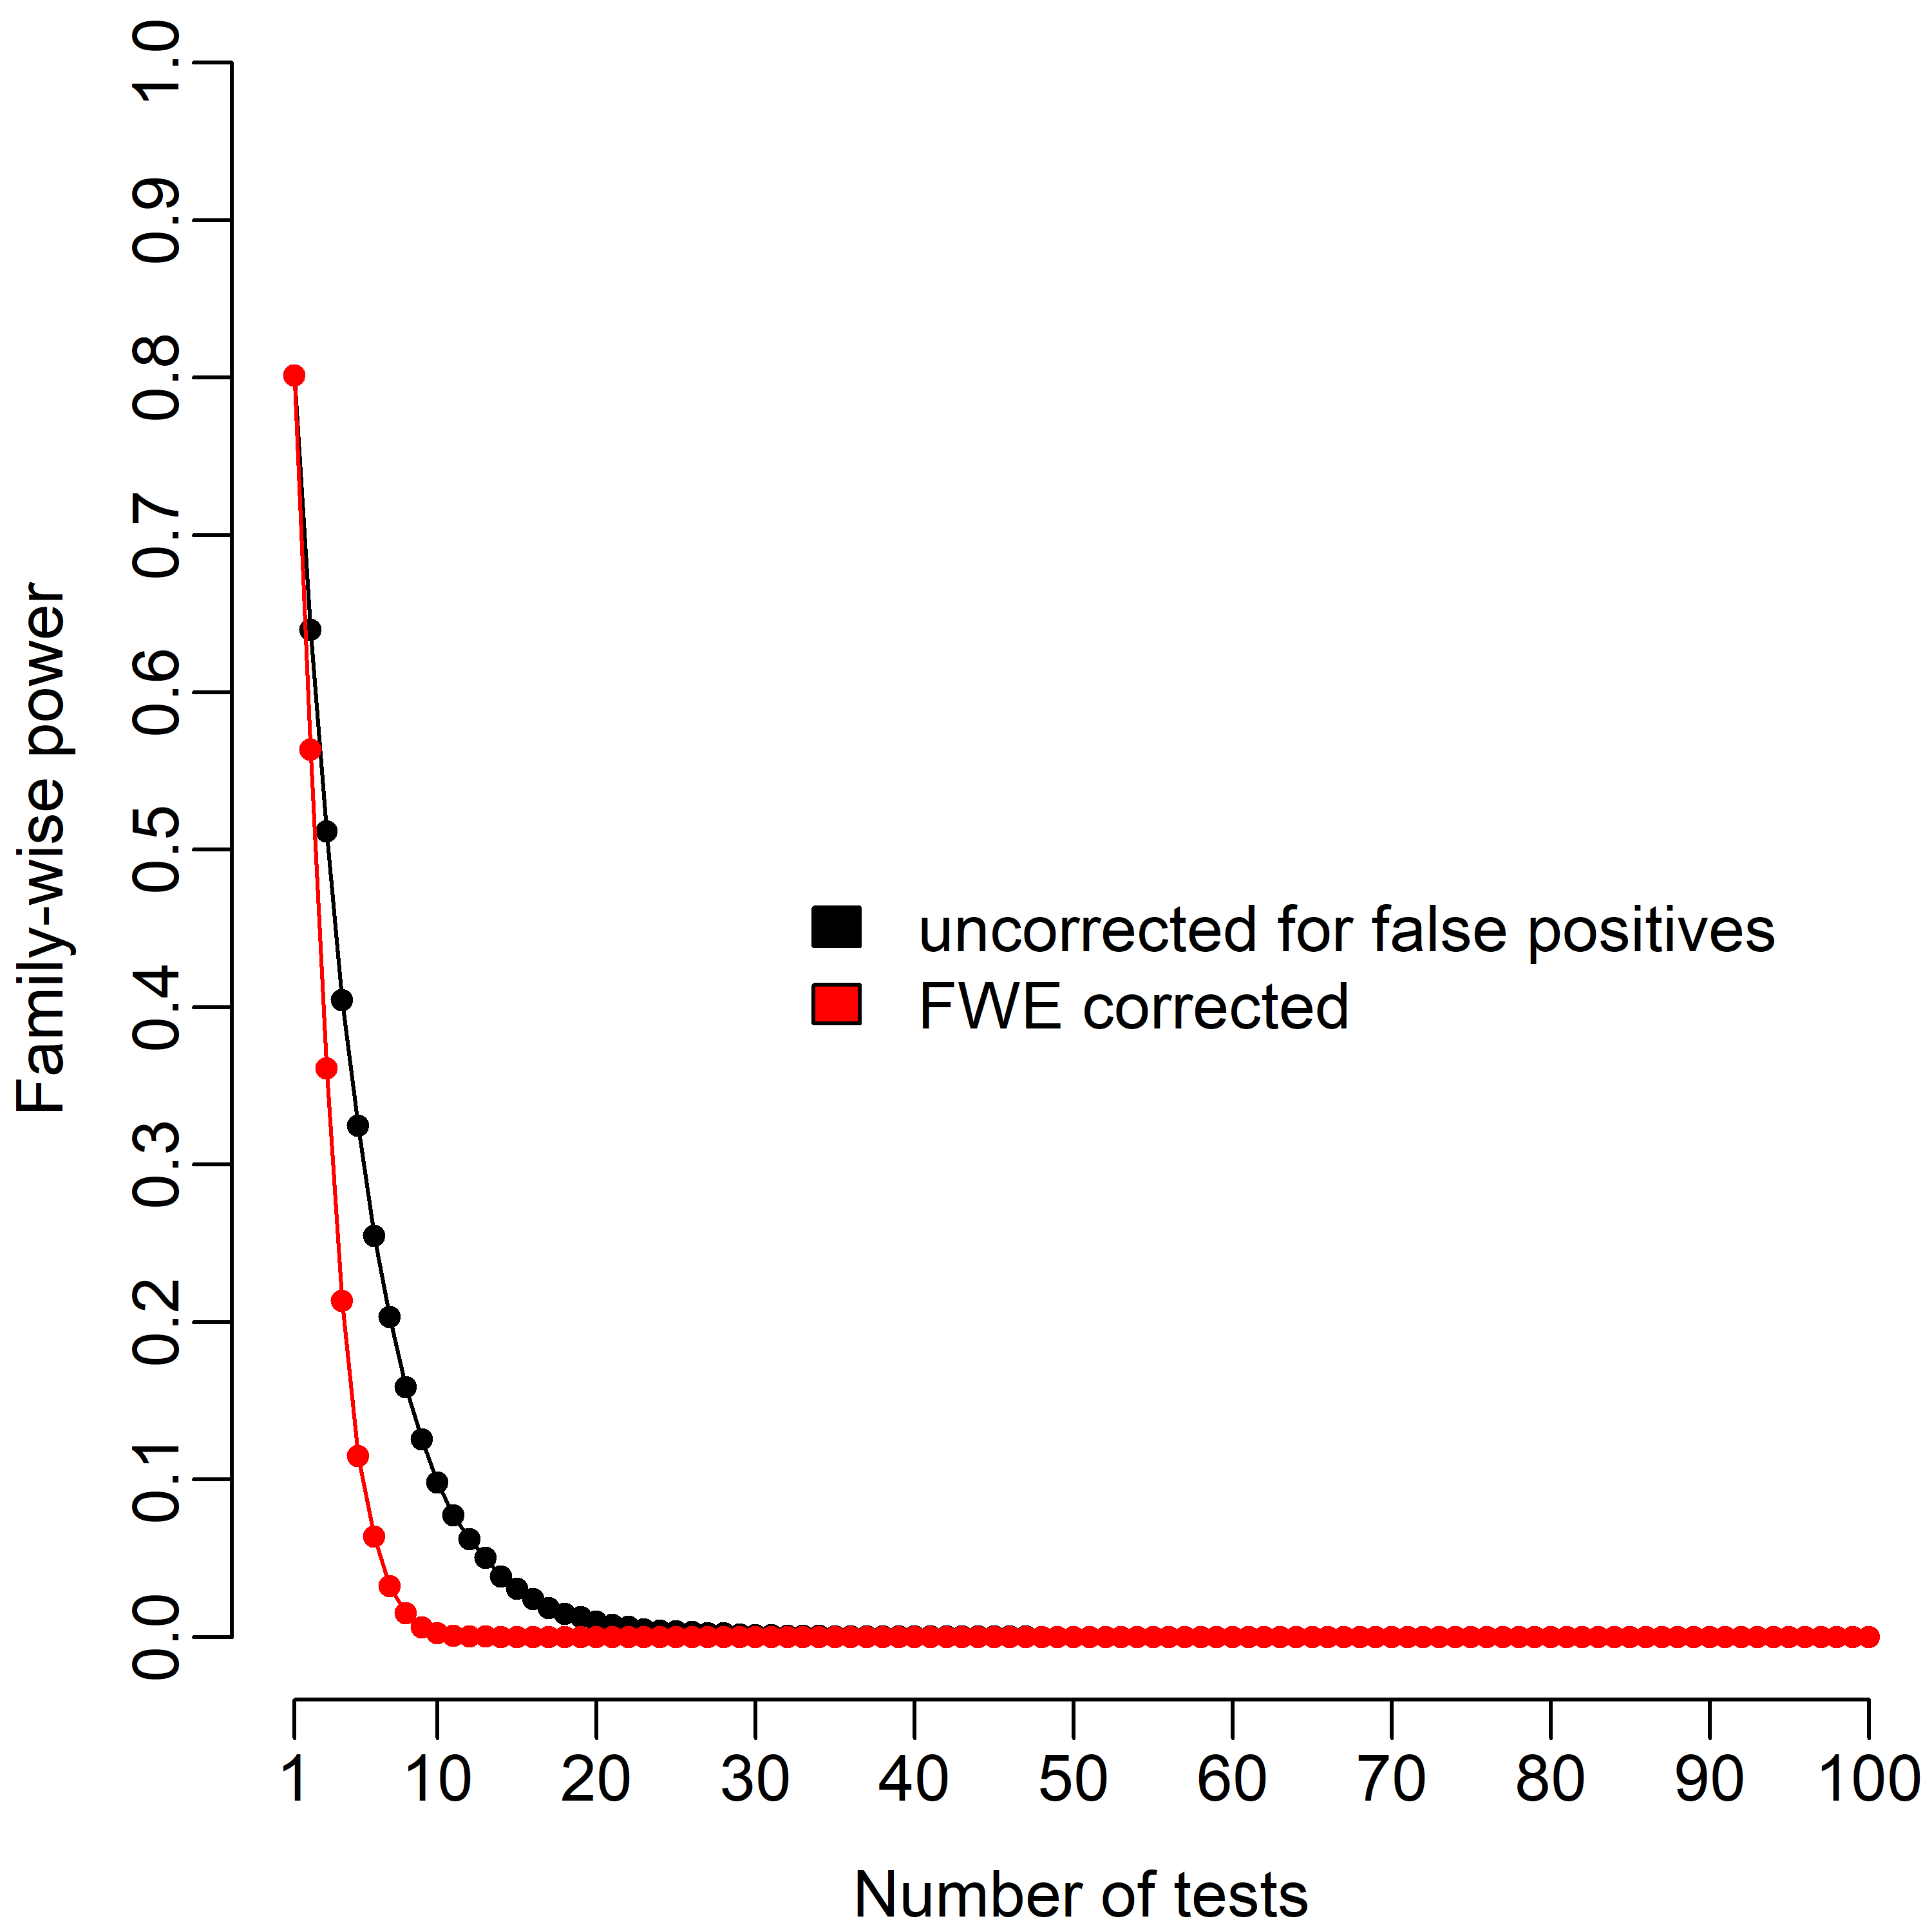
As you can see, the drop off in power as a function of test number is even more drastic than the increase in the false positive rate. This is because every independent test one conducts multiplies the risk of experiencing a false negative, and exponentials change very fast! The case is even worse when controlling FWE via the Bonferroni correction (red) - in this simulation it takes only six tests to reduce the gold-standard of 80% down to single digits.
So, what is to be done about this? The traditional answer in most of psychology has often been to ignore both FWE and FWP, except in specialized cases like ANOVA post hoc tests. Only in areas of research like fMRI or genetics, where the multiple comparisons are enormous, has FWE-control become a necessity for publication. Even in these domains, the reciprocal question of power and false negatives has not been widely discussed.
If one really cares about the risk of false negatives, then FWP can indeed be controlled. Unfortunately, there's no free lunch. Holding power constant as one increases the number of tests means increasing one's sample size. How much? That will depend greatly on the specifics of your data, but below I illustrate what it would look like for our simple example of independent one-sample t-tests, with FWE = .05, and FWP = 80%.
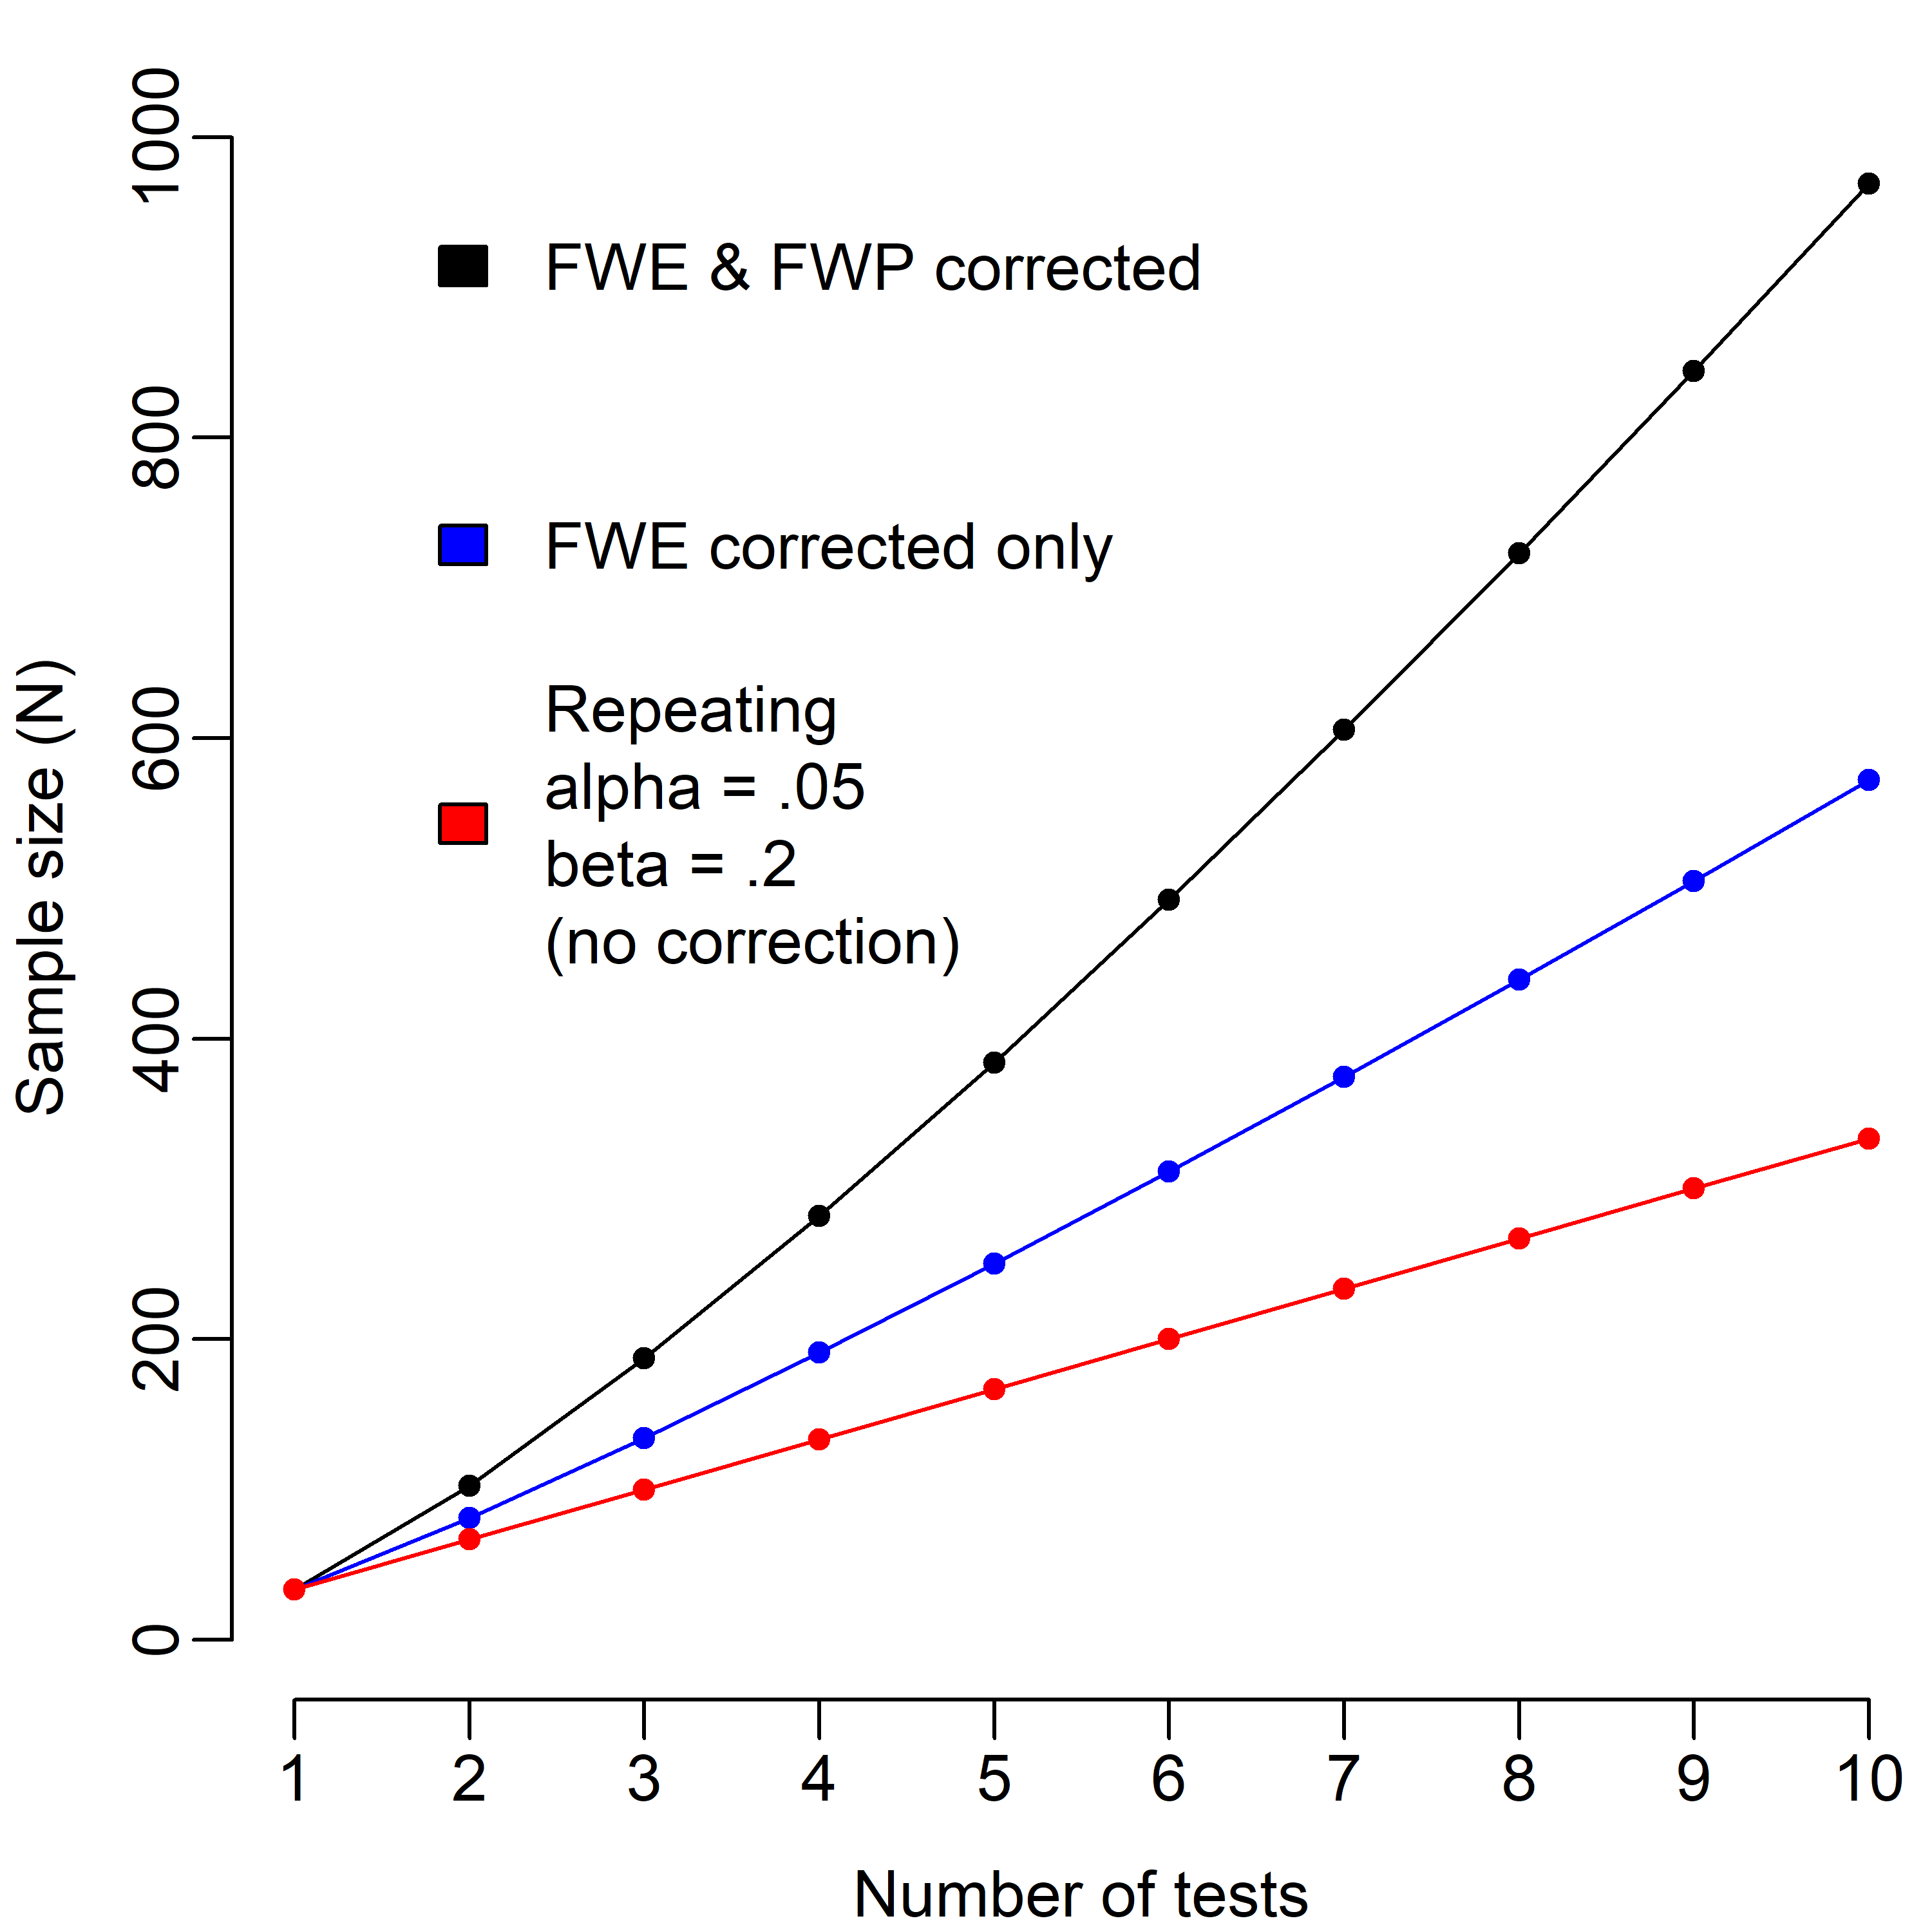
In the baseline case of no correction, the sample size will simply be the original sample size multiplied by the number of tests. The slope of the line is slightly steeper if one wishes to control for FWE, and much steeper (indeed, slightly supra-linear) if one wishes to correct for both FWE and FWP. If one conducts 10 tests, this would require about 300 participants uncorrected, and about 1000 in the fully corrected case - a 3-fold difference. By this time, the power of each individual test in the corrected family is 97.8% at α = .005 - far stricter than the current conventions. The reality may be less harsh in some cases though: for instance, if your tests are somehow dependent on one another, then this would likely reduce your power problem relative to the curves illustrated above. Heterogenous effect sizes, sequential testing, data dependency and distribution, and a whole host of other factors will likely influence the particulars as well.
What do you do if this graph has caused you to... reevaluate... how much you care about false negatives? One option would be to simply avoid multiple testing. Another would be to accept that, if you conduct a lot of tests, you'll probably have some false negatives amongst your results if you don't correct your sample size accordingly. After all, perhaps you're alright with a few false negatives in your family of tests? That's a defensible position, but wouldn't it be nice to have a alternative statistical standard to provide some control over power, even if FWP is too strict?
There may be such a standard. We'll call it the false non-discovery rate (FNR) as a reference to the approach we're mirroring - the false discovery rate (FDR). FDR is a long-established alternative to FWE for dealing with the multiple comparison problem. Rather than limiting the risk of any false positive amongst a set of tests, FDR limits the proportion of positives that are false. It's a subtle difference, so let's say it again: FWE = .05 means you have a 5% chance of *any* false positive in the test family, whereas FDR = .05 means that 5% of the positives you observe in the family *are* false (asymptotically). By analogy, FWP = 80% would mean an 80% chance of detecting all present effects, whereas FNR = .2 would mean that 20% of the negatives you observed were actually positives.
It's difficult to talk in generalities about the conservativeness of FDR/FNR relative to FWE/FWP because it depends on how many true negatives and positives are present in a data set. If all tests are true positives, then FNR is just as strict as FWP, but as the number of true negatives increases FNR will become correspondingly more lenient in comparison to FWP. Since FNR will never be stricter than FWP, it might be a reasonable alternative for someone looking for less conservative control over false negatives. As far as I know, there aren't specific procedures currently available for controlling FNR. However, approaches for controlling FDR are probably a reasonable place to start.
I hope this piece has given you another perspective on the problem of multiple comparisons. As you can see, achieving strict control over both type I and II error rates in such scenarios may require substantially augmenting sample sizes relative to the baseline suggested by power analysis of a single test. The code used to produce the figures above is available here.

© 2017 Mark Allen Thornton. All rights reserved.