Postings on science, wine, and the mind, among other things.
The Open Science Twitterverse
A meta-scientific revolution is underway, and it's on Twitter. I examine its activity and network structure.
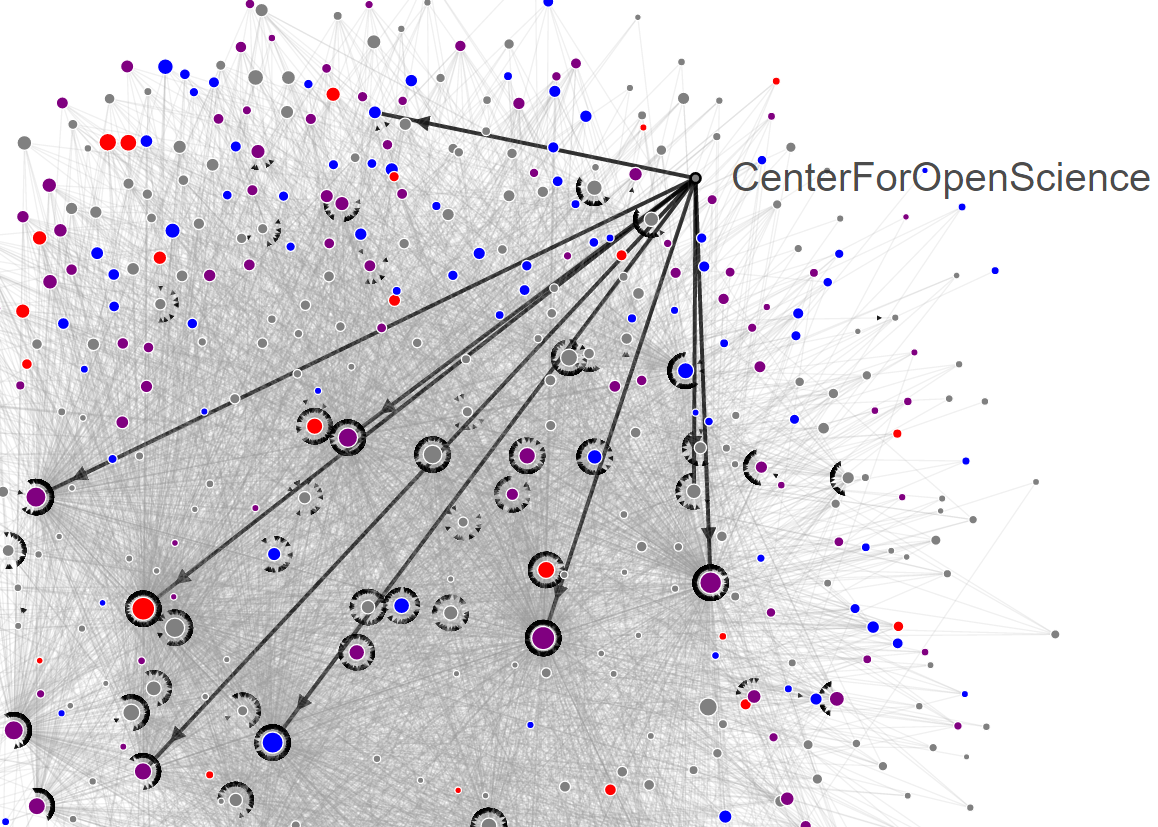
Click for interactive version
A popular stereotype of scientific revolution involves intensely private activity: a team of researchers toiling in cloistered obscurity or a solitary genius laboring within the seclusion of their own mind. It is questionable whether this notion was ever really representative of how science progresses, but it is certainly untrue of science's most recent sea-change: the open science revolution. This revolution is unlike those of the past in another way as well. Rather than directly transforming our understanding of the world, like the theories of relativity or evolution, the open science revolution is meta-scientific: at its heart are scientists trying to change the way that science itself is habitually conducted.
Free exchange of information, open science advocates claim, is a core scientific value that is, at present, poorly realized. Far too rarely, they argue, do researchers make their raw data publicly available for others to pore over. Analysis code and lab protocols all too frequently end up as in-house trade secrets, hindering the ability of other groups to reproduce and build upon previous research. Perhaps worst of all, the vast majority of scientific product, in the form of peer-reviewed articles published in journals, ends up behind prohibitively-expensive paywalls that effectively exclude anyone without a university affiliation from reading them, including the taxpayers who indirectly fund most work. Together these deficiencies limit the efficiency of science and may even hold back efforts of crucial practical importance, such as curing diseases.
The open science movement is trying to change all that, and they are doing more than simply advocating for more sharing. Founded by Brian Nosek and Jeff Spies, the Center for Open Science (COS) has played a central role in many recent efforts. COS helped promulgate the Transparency and Openness Promotion (TOP) Guidelines which as of writing have been signed by 538 journals and 57 other organizations. They also developed the Open Science Framework, a powerful platform for preregistering studies, organizing and version controlling ongoing projects, and sharing research materials with others. COS is far from the only game in town, however. Repositories such as figshare and The Dataverse Project are also major players, providing additional venues to share data, figures, preprints, and beyond. In my own field, projects like OpenfMRI and NeuroVault are making it easier to share fMRI data, while other projects such as Tal Yarkoni's Neurosynth, an automated fMRI meta-analysis platform, are allowing us to easily put large data sets to work.
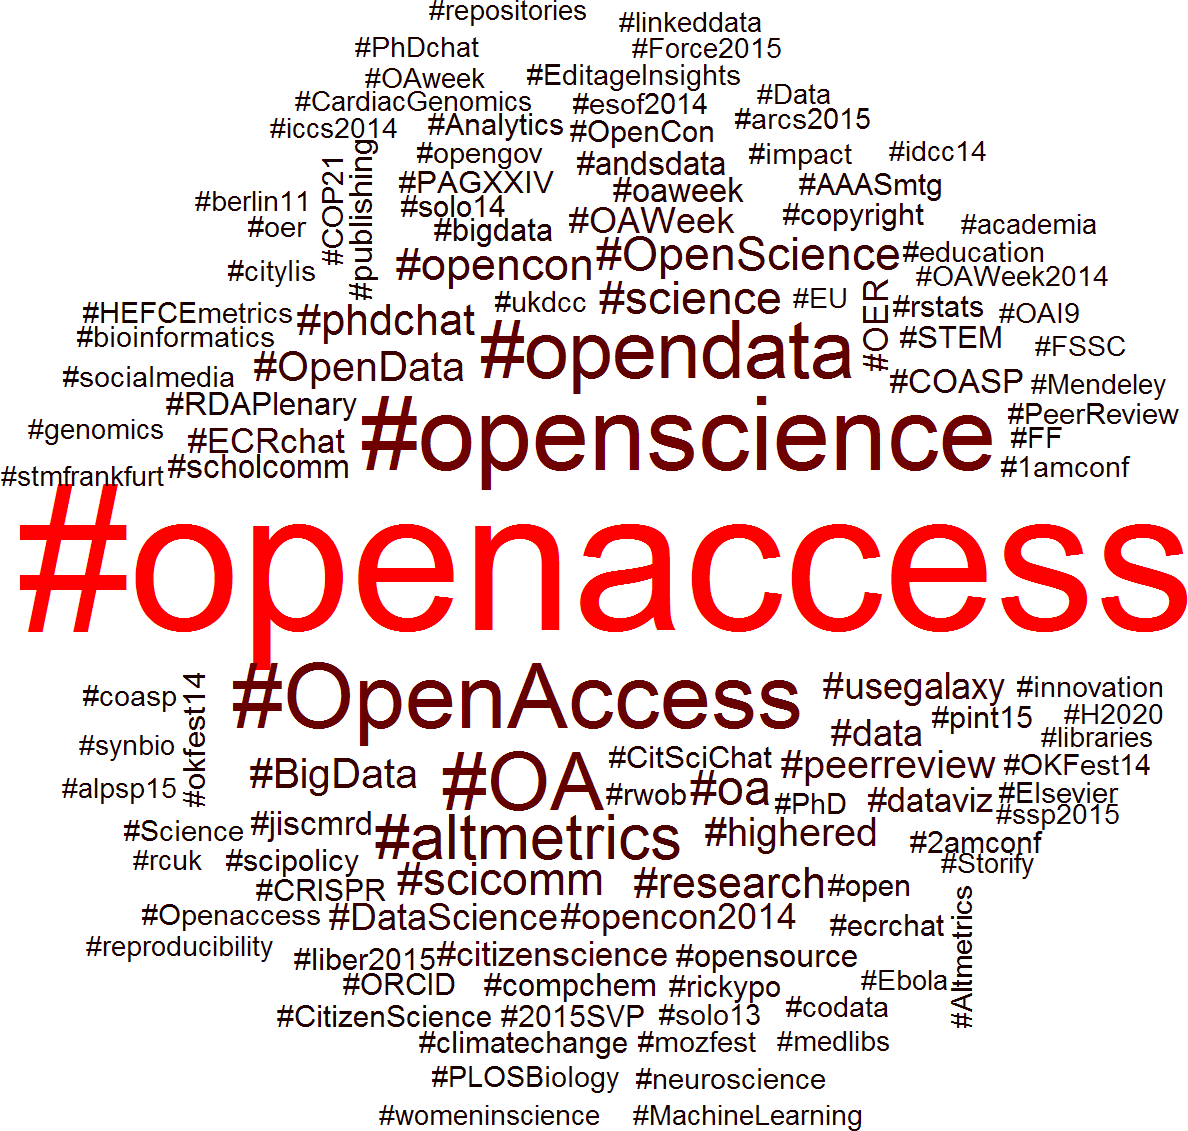
The melange of issues of interest to the open science twitterverse, as revealed by hashtag frequency (proportional to text size and redness).
On the publishing side, every year sees more open access (i.e. not paywalled) journals emerge, and under pressure many traditional journals have expanded or improved their open access options. The Winnower aims to change scholarly publication more fundamentally by, among other things, shifting the peer review process to a public, post-publication model rather than a private pre-press one. An older but effective model is Cornell University's arXiv open access preprint site, which has allowed whole fields, including most of physics, mathematics, and computer science, to largely sidestep the problem of paywalls. Open science overlaps with the older and more extensive open source coding movement in many respects, and so even organizations like the free-software nonprofit Mozilla Foundation (yes, the one that supports Firefox) are getting in on the action.
Proponents of open science are also trying to tackle a tougher problem: changing scientist's incentives. They contend that one of the reasons that the status quo is so far from the ideal is that perverse incentive structures have developed in science and academia. The hackneyed phrase "publish or perish" may be a bit of a joke to those outside academia, but to many of those on the inside it can prove a grim (if typically not literal) reality. Modern academia is fiercely competitive at every level, and only gets more so as one moves up the ladder (at least until the blessed release of tenure, or so I'm told). Publishing papers, preferably a lot of them, and in "high impact" journals, is still undeniably the surest path to success. With so many others striving alongside them to land one of the too few tenure track jobs available, early career researchers may feel pressured to budget their time in a way which most effectively advances their career goals. In such an atmosphere, it is easy to imagine how 'nice but unrecognized' activities like data sharing might unfortunately go by the wayside.
Changing such incentives will likely prove difficult, partially because they are so entrenched and partially because creating incentives requires the power to reward, and power is seldom easy to come by. Nonetheless, efforts are underway by individuals at every level of the academy and beyond. OSF, for instance, takes both direct and indirect approaches to incentivizing open science, paying out cash sums as in its ongoing preregistration challenge, as well as creating a 'points' system to encourage participation in the site more generally. Some journals have started making the deposition of data in a public repository a condition of publication, while others have implemented rewards systems like Psychological Science's badge system. On a smaller scale, many PIs have mandated the adoption of open science and reproducibility practices within their own labs, and some potential reviewers refuse to read manuscripts for which the data is not made openly available. Others are hard at work attempting to create new indices of scientific value which may reduce the pressure of 'publish or perish' culture. Still, creating better incentives is doubtless one of the open science movement's highest stumbling blocks, and it remains to be seen whether or how well they will clear it.
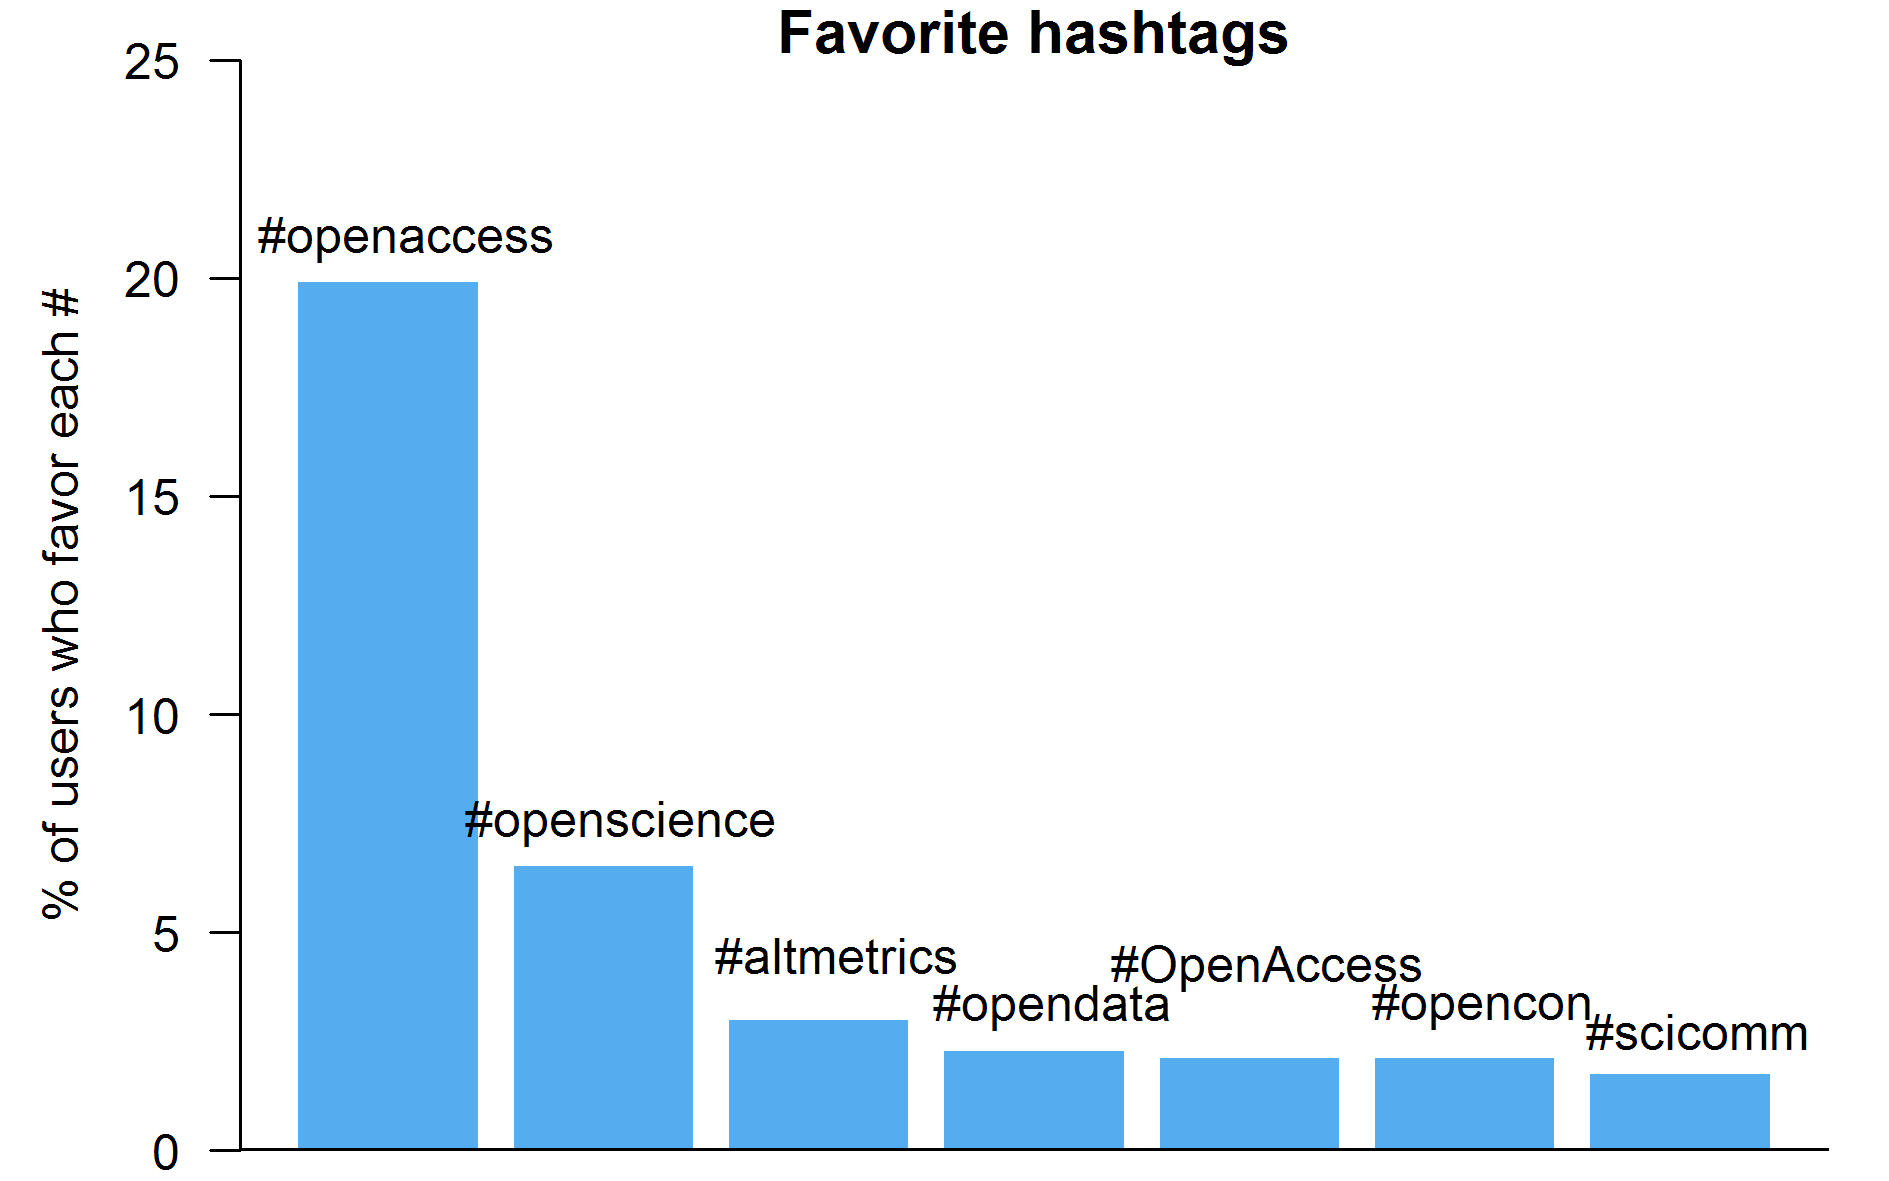
Frequencies of a few favorite hashtags within the open science twitterverse.
The open science movement is not without its critics. In a recent editorial published in prestigious the New England Journal of Medicine (co-authored by its editor-in-chief and a deputy editor), the concept of data sharing as currently imagined was subjected to harsh critique. The authors discussed the worry that data may be chronically mishandled or misunderstood if opened to people who did not conduct the primary research. They also considered the possibility that a "new class" of "research parasites" who might emerge and begin "stealing from the research productivity planned by the data gatherers, or even use the data to try to disprove what the original investigators had posited." The editorial was predictably blasted by many researchers on Twitter and elsewhere as inimical to core values of science. The reaction was so negative that a clarification was issued by NEJM shortly after.
That said, Twitter, like many online forums, can have echo-chamber-like properties, creating an illusion of consensus. Some pointed out that fears such as getting "scooped", or even worse, having one's published work publicly debunked, are fairly common among those ambivalent about open science. No matter how committed one is to the scientific endeavor, public proof that one has erred cannot be pleasant. This is true even when the correction is done gently and with the best intentions, to say nothing of the possibility of a more aggressive approach. Fears over the possibility that transparent research might lead to increased "bullying" are being taken seriously by some, with efforts underway to more clearly delineate the boundary between proper data use and abuse. Others raised the possibility that individuals from societally disadvantaged groups may suffer more of the costs and fewer of the benefits of data sharing.
Perhaps the greatest opponent the open science movement faces, however, is simply inertia. Customs and standards accrete on institutions even without any conscious effort to produce them, and academia has had longer to accumulate such baggage than most institutions. Open science advocates are generally upbeat about the eventual triumph of their cause, viewing it as an ultimately inevitable change in scientific culture. As a methods wonk who finds data analysis one of the most enjoyable parts of research, I rather hope they are right, as it would mean much more data to play with (or parasitize, I suppose, depending on one's point of view). However, while science itself may make inexorable (if sometimes sidetracked) progress, the same is not necessarily true of scientific culture. History is unfortunately littered with the remains of failed social reform movements, and there is no guarantee that open science may not end up among them. Even if it does eventually triumph, we cannot be sure what form it will take, as there are likely at least as many visions for open science as there are open science advocates.
Regardless of open science's prospects, it does provide us with a unique opportunity to examine a (meta-)scientific revolution in progress. Consistent with the values of the movement, much of the discussion of open science is occurring in that most public of venues: Twitter. As described below, I've accessed data from Twitter to reconstruct and analyze a version of the open science twitterverse. I hope that this may provide an informative snapshot of the open science movement, describing the properties of some of its major players and their relations to one another. Read on if you're interested in how I went about doing this and what I found.
Methods
Twitter, like many tech companies, provides something called an API (application programming interface) that allows people outside of the company to programmatically access some of their data. APIs are typically created in the hope that third parties will use them to develop new applications (apps). The creation of such apps, whether they are Facebook games, mobile Reddit apps, or simply automatic logins, generally feed back into the value of the original company in positive ways. However, we can also use APIs to conduct a variety of research. In the past, for instance, I have used Wine.com's API to examine the relationship between back label descriptor frequency and quality ratings. In the present case, I accessed data from the Twitter API using the convenient R package twitteR.
My first goal was to establish an approximate membership for the open science twitterverse. There is no definitive list of who is or is not an open science advocate (on Twitter) and I didn't dare try to manually define one. Instead I took an admittedly imperfect but at least data-driven approach. This approach consisted of two different stages, in the hopes that any biases in each might at least partially offset. First, I searched for use of the term "open science" or the hashtag "#openscience" in recent tweets. Aggregating these by source, I identified habitual users of these terms and selected approximately the top 1% to form a 'core group' of accounts that were almost certainly part of the open science twitterverse. Next, for each of these accounts I scraped lists of who they followed and who followed them. I counted the number of reciprocal connections between these new accounts and the core group, and selected those above the .25 quantile of intra-core connectivity as a secondary group.
This process obviously involved a number of semi-arbitrary choices, and if anyone was inadvertently cut out of the network as a result of these choices I can only offer my apologies (and the data and code, so you can redo it better - see below). The primary motivation for the particular choices I made was to keep the size of the network manageable. This was important both for practical reasons (to avoid including so many nodes that visualization became impossible) and principled reasons (to ensure that it was really the open science twitterverse, and not just a more general science twitterverse). Note, however, that inclusion in the network does not necessarily imply that someone is a proponent of open science. The publishing company Elsevier, for example, is included despite the fact that its paywalls have led to the use of the satiric corruption "El$evier" by some. The use of reciprocal connections was valuable at this stage both because they are rarer than unidirectional connections, and because they help to filter out accounts like celebrities, who might have been followed by many of our open scientists but not followed back.
The final stage of data collection involved scraping detailed information on each of the accounts in the open science user list I had just defined. This involved both retrieving their account details as well as all of their tweets (up to the API's limit of 3200). This step was time consuming but not particularly challenging. After a bit of preprocessing, I was left with a wealth of data on each member of the network as well as on the overall nature of the group.
The network analyses are worth mentioning due to a few more choices that had to be made at this point. First, I defined the network based on actual communication between accounts (i.e. retweets and replies) to better reflect the actual nature of information exchange. This also helped make the network a bit more interesting, as following someone on Twitter is a fairly low bar, and thus follower-followee networks tend to end up rather boringly saturated. Additionally, focusing on actual activity helped make the results a bit less circularly dependent on the selection method. I used a version of the network weighted by interaction frequency to calculate network properties such as centrality. I used also used a weighted network, but ignored directionality, to find clusters (called communities) in the network using the Louvain method, which proved the most effective community detection technique out of several I applied.
To avoid outstanding irony, given the focus of this piece, all of my code (R and the javascript for the network visualization) and data are openly available on the Open Science Framework, here. Feel free to write me with questions or suggestions!
Results
The results are most easily explored through the interaction network visualization I created using d3.js, but I highlight a few interesting results below. The hashtag figures earlier are also from this dataset, naturally.
Account age
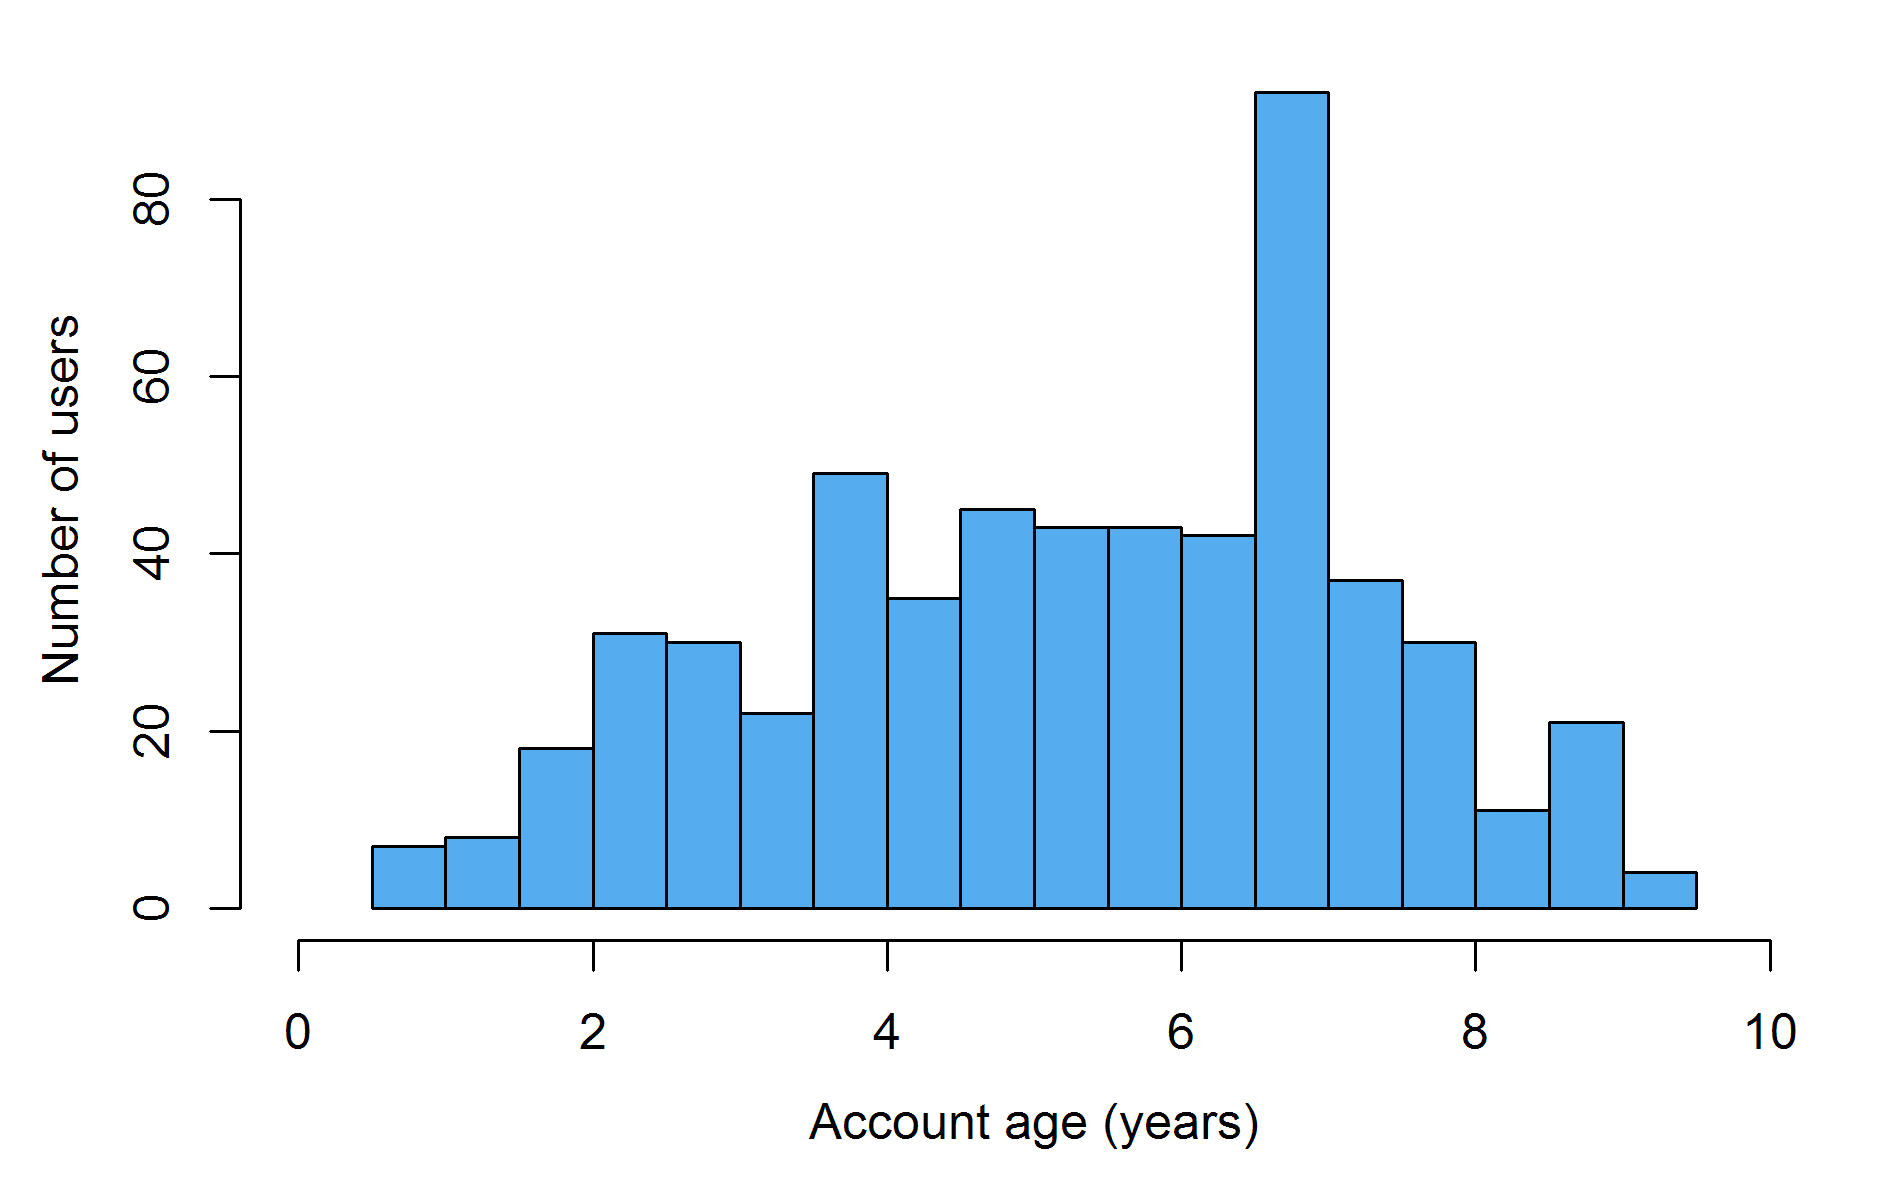
Account ages in the open science twitterverse vary substantially, with some nearly as old as twitter itself (almost 10 years, as of writing) and others less than a year old. A peculiar spike appears around 6.5 years ago, perhaps corresponding to some event which provoked many sign-ups. Pace that aberation, the distribution follows a rough inverted U-shape, but this is difficult to interpret (e.g. is the movement gaining momentum or losing it?) for a couple of reasons. One is that this would really require an adequate control group (or perhaps the whole size of Twitter) which I do not have at hand. Another issue is that the selection method itself is biased towards picking people with older accounts, since very young accounts would be unlikely to have reciprocal relationships with the established 'core group' described above.
Activity
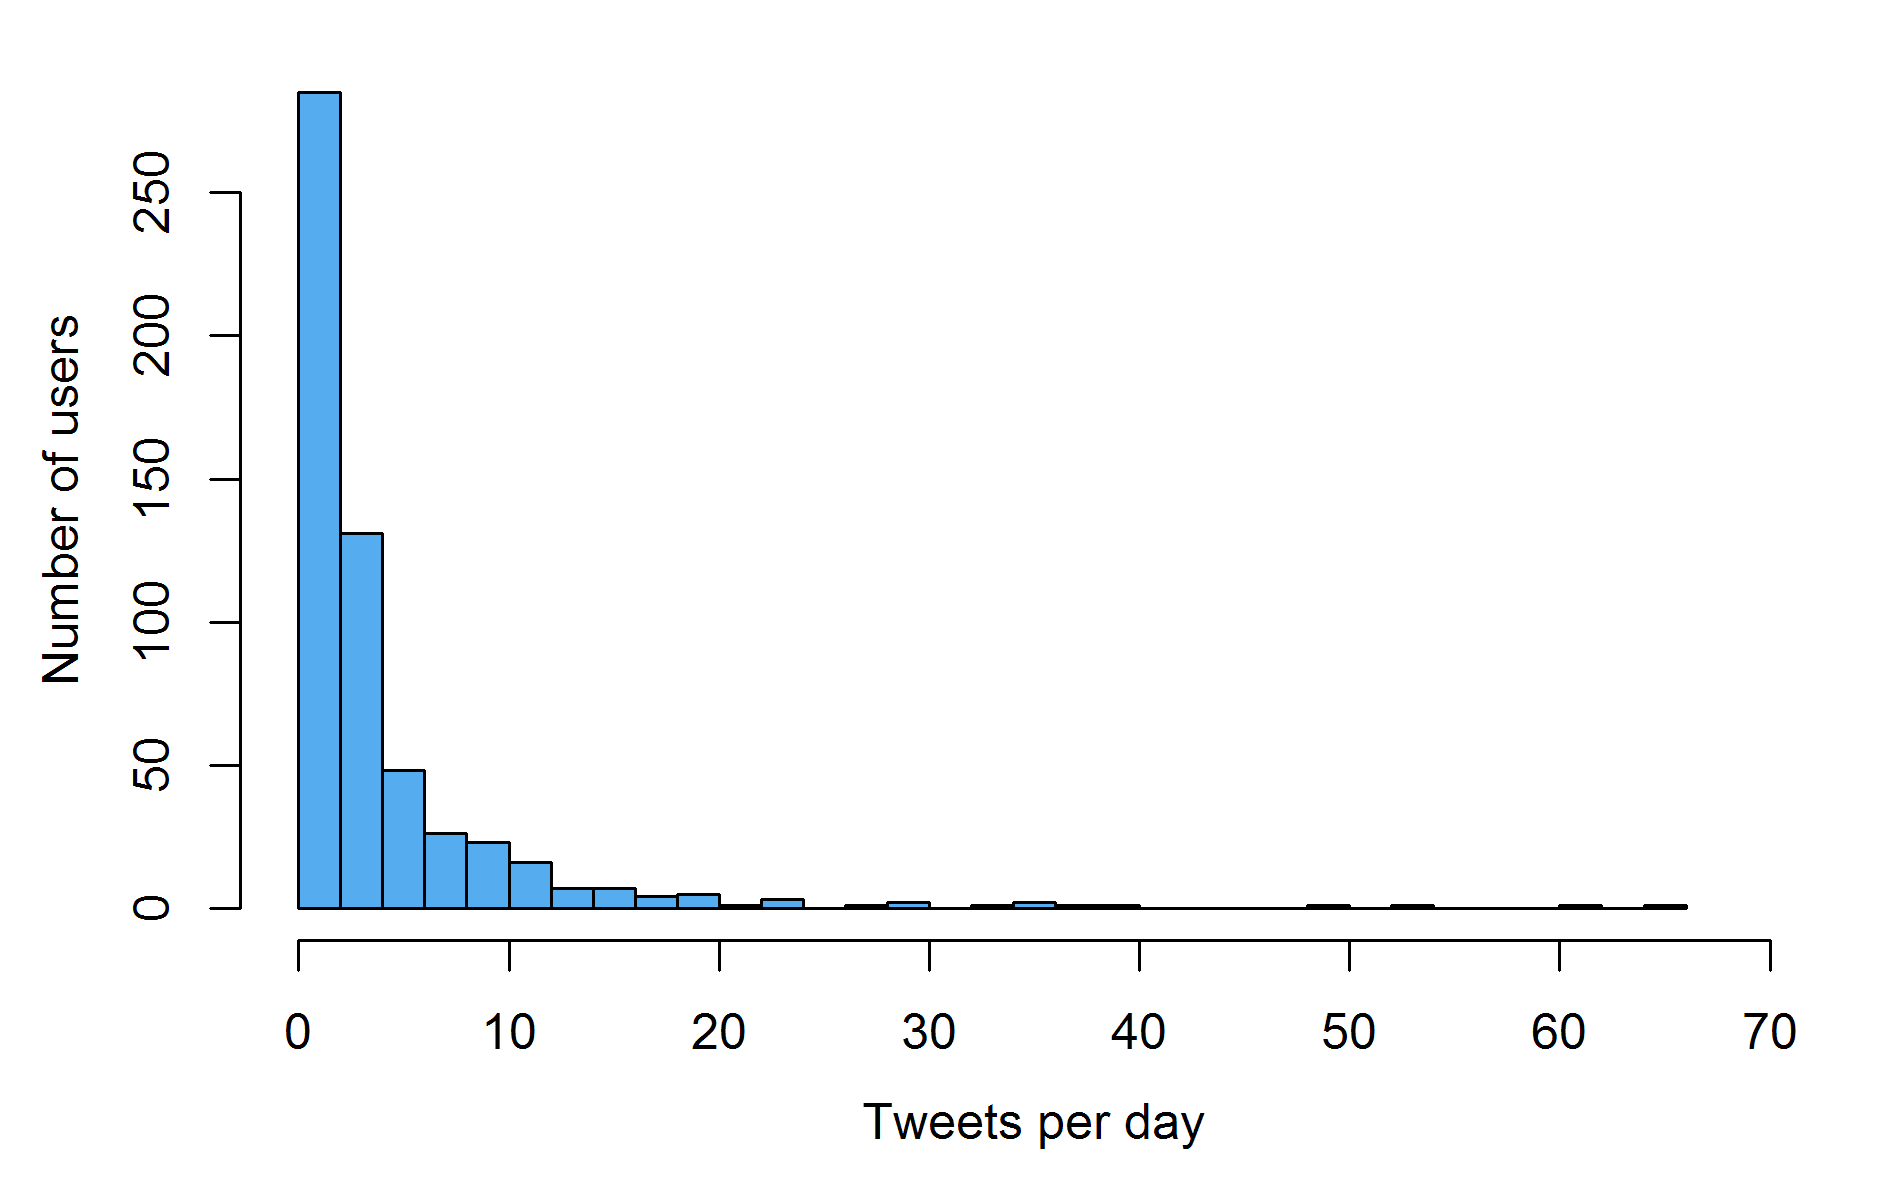
Twitter certainly seems to follow the 99% rule of the internet, in that a small fraction of the users seem to be producing most of the content. This is made even clearer in the figure below which examines what proportion of tweets are original (vs. retweets or replies).
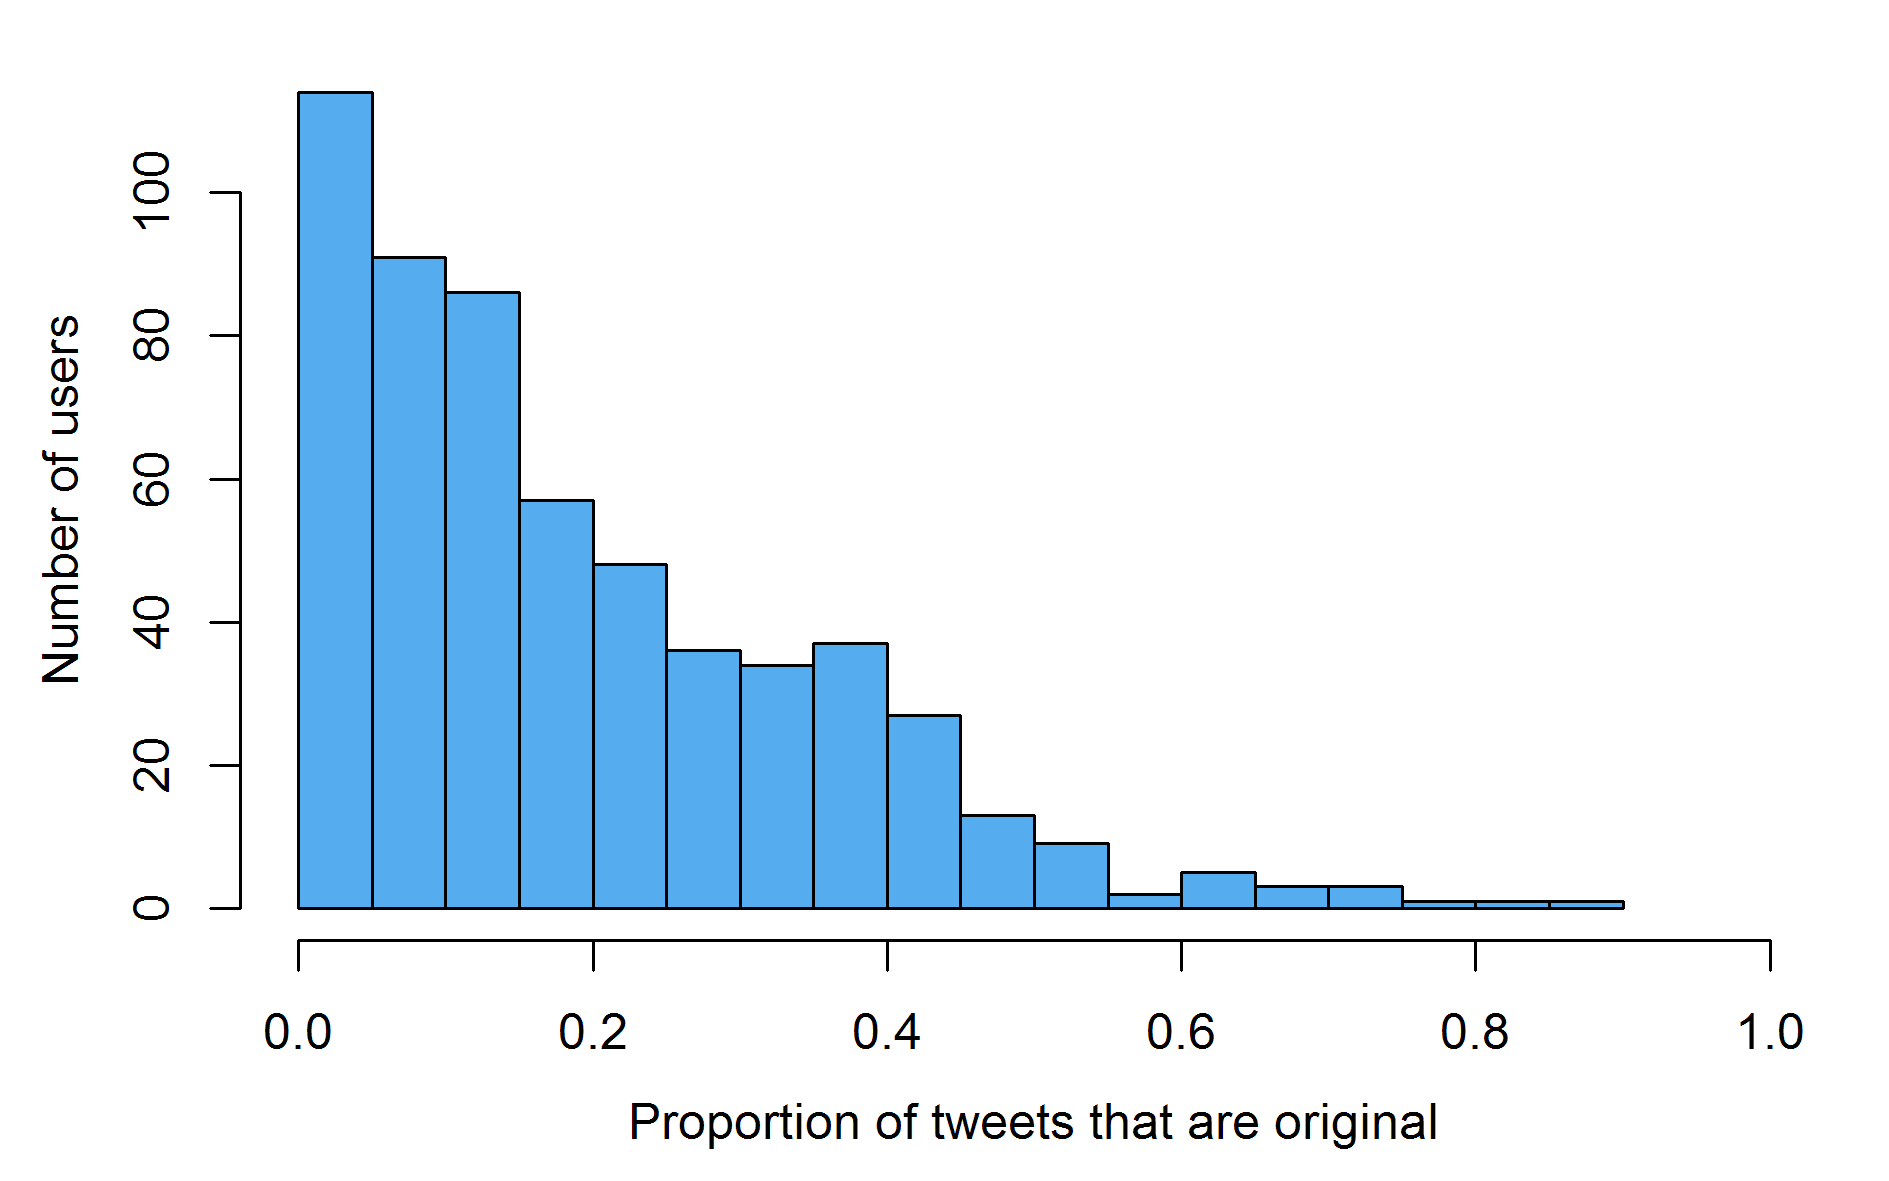
While not quite as skewed as the raw activity graph above, examination of the frequency of original tweets reveals that retweets and replies make up more than half of the tweets of the vast majority of users in the open science twitterverse.
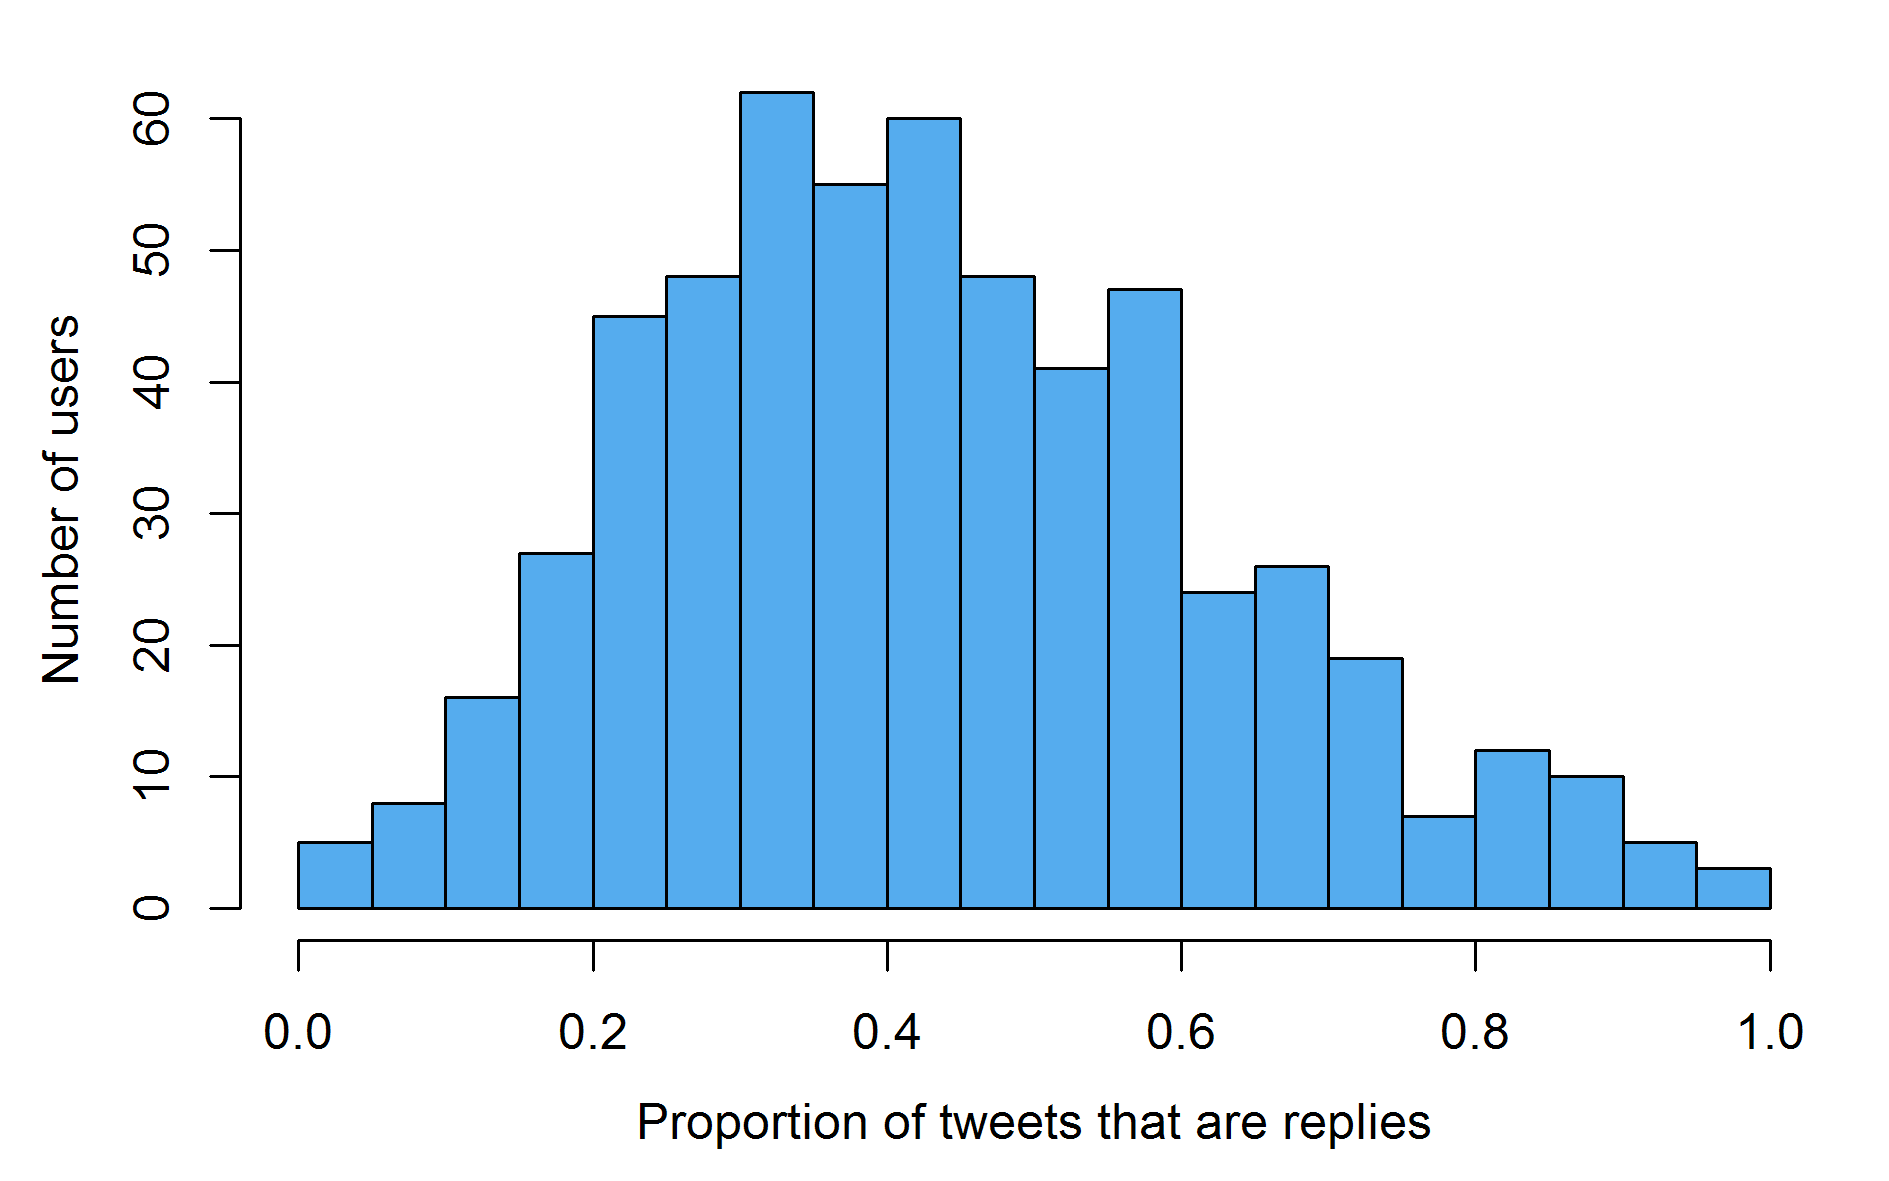
Things look a bit better when one examines the reply histogram. It is clear that most users in the network are interacting with each other as a sizeable proportion of what they do on twitter.
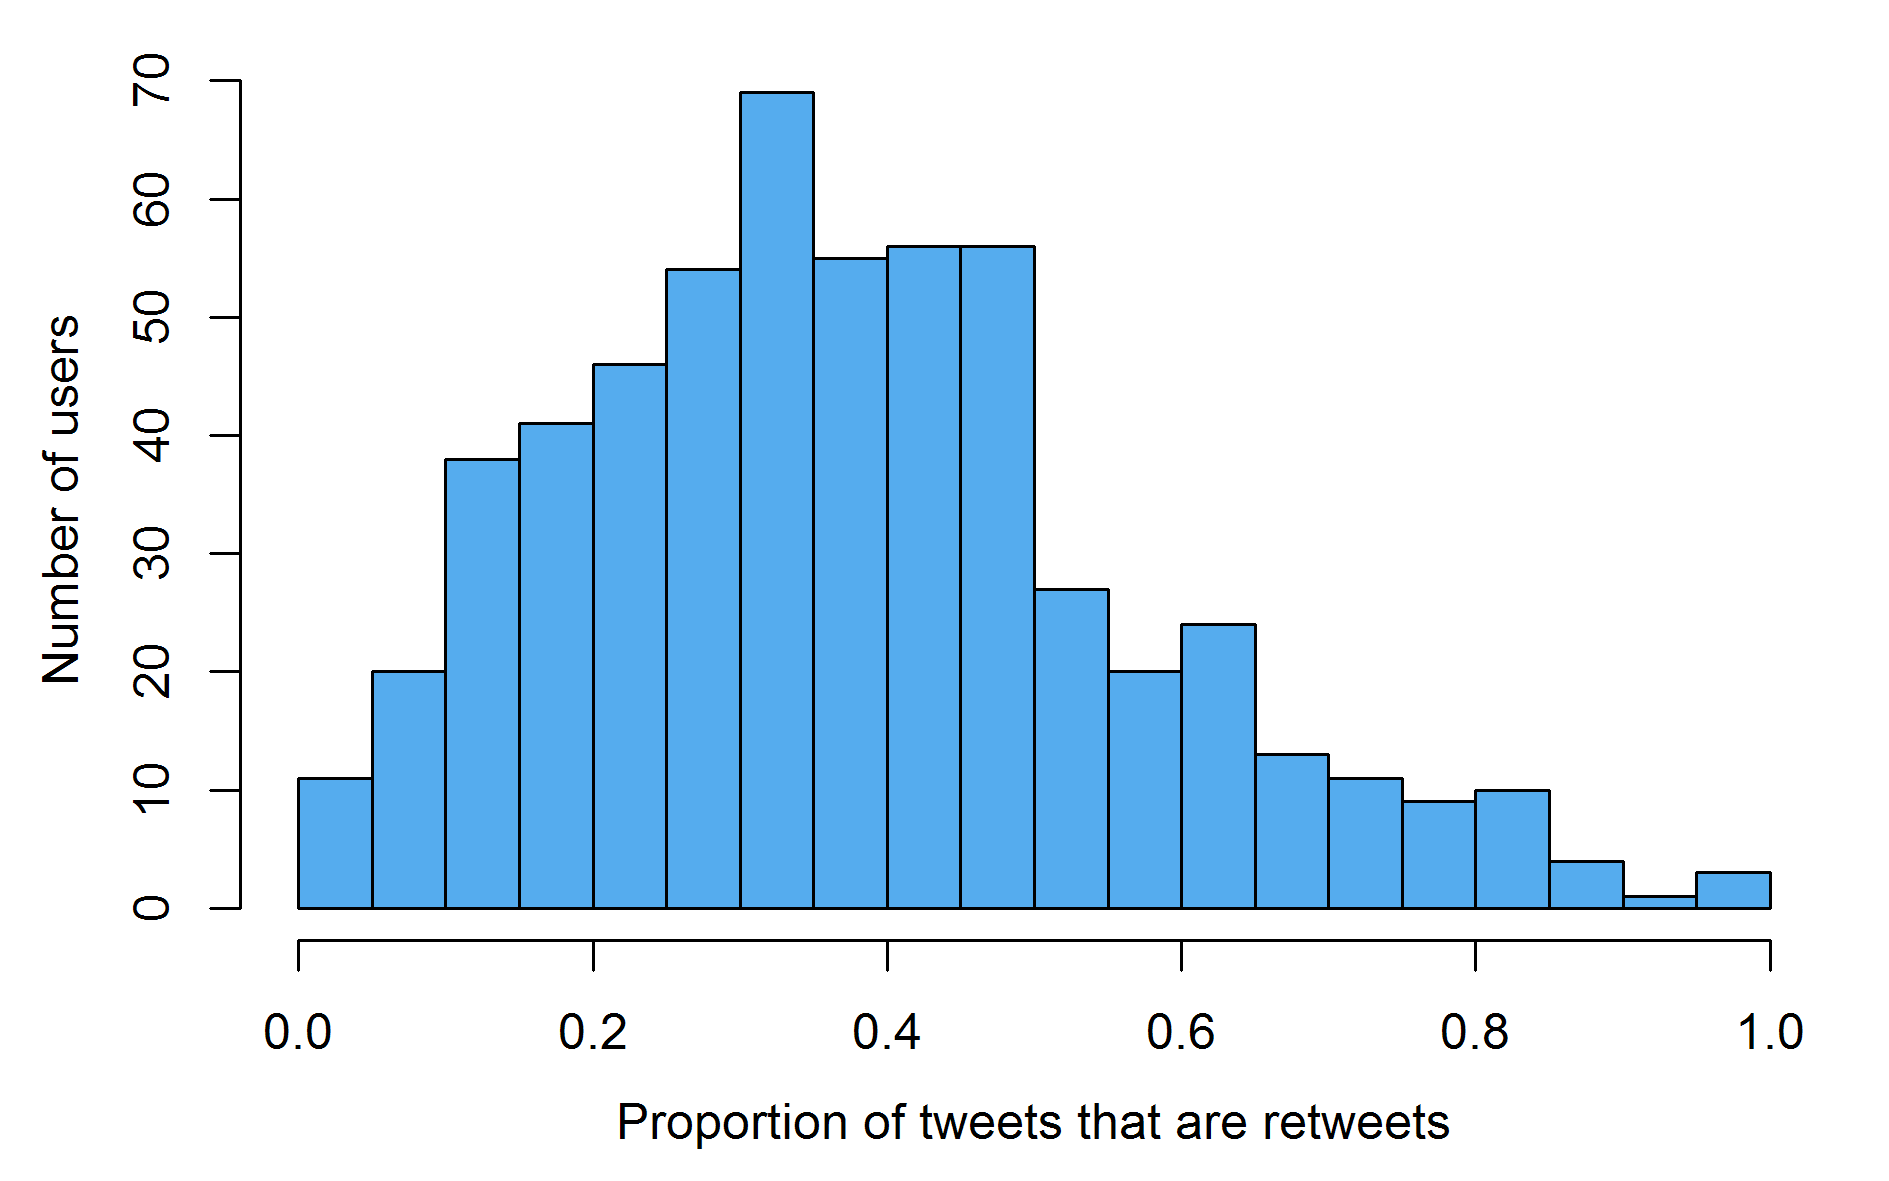
The distribution of retweets proportions looks similar to that for replies, with a central tendency around 35% of their activity coming in the form of retweets. Retweets are an essential part of Twitter, as they represent a relatively low effort cost by which information can be spread.
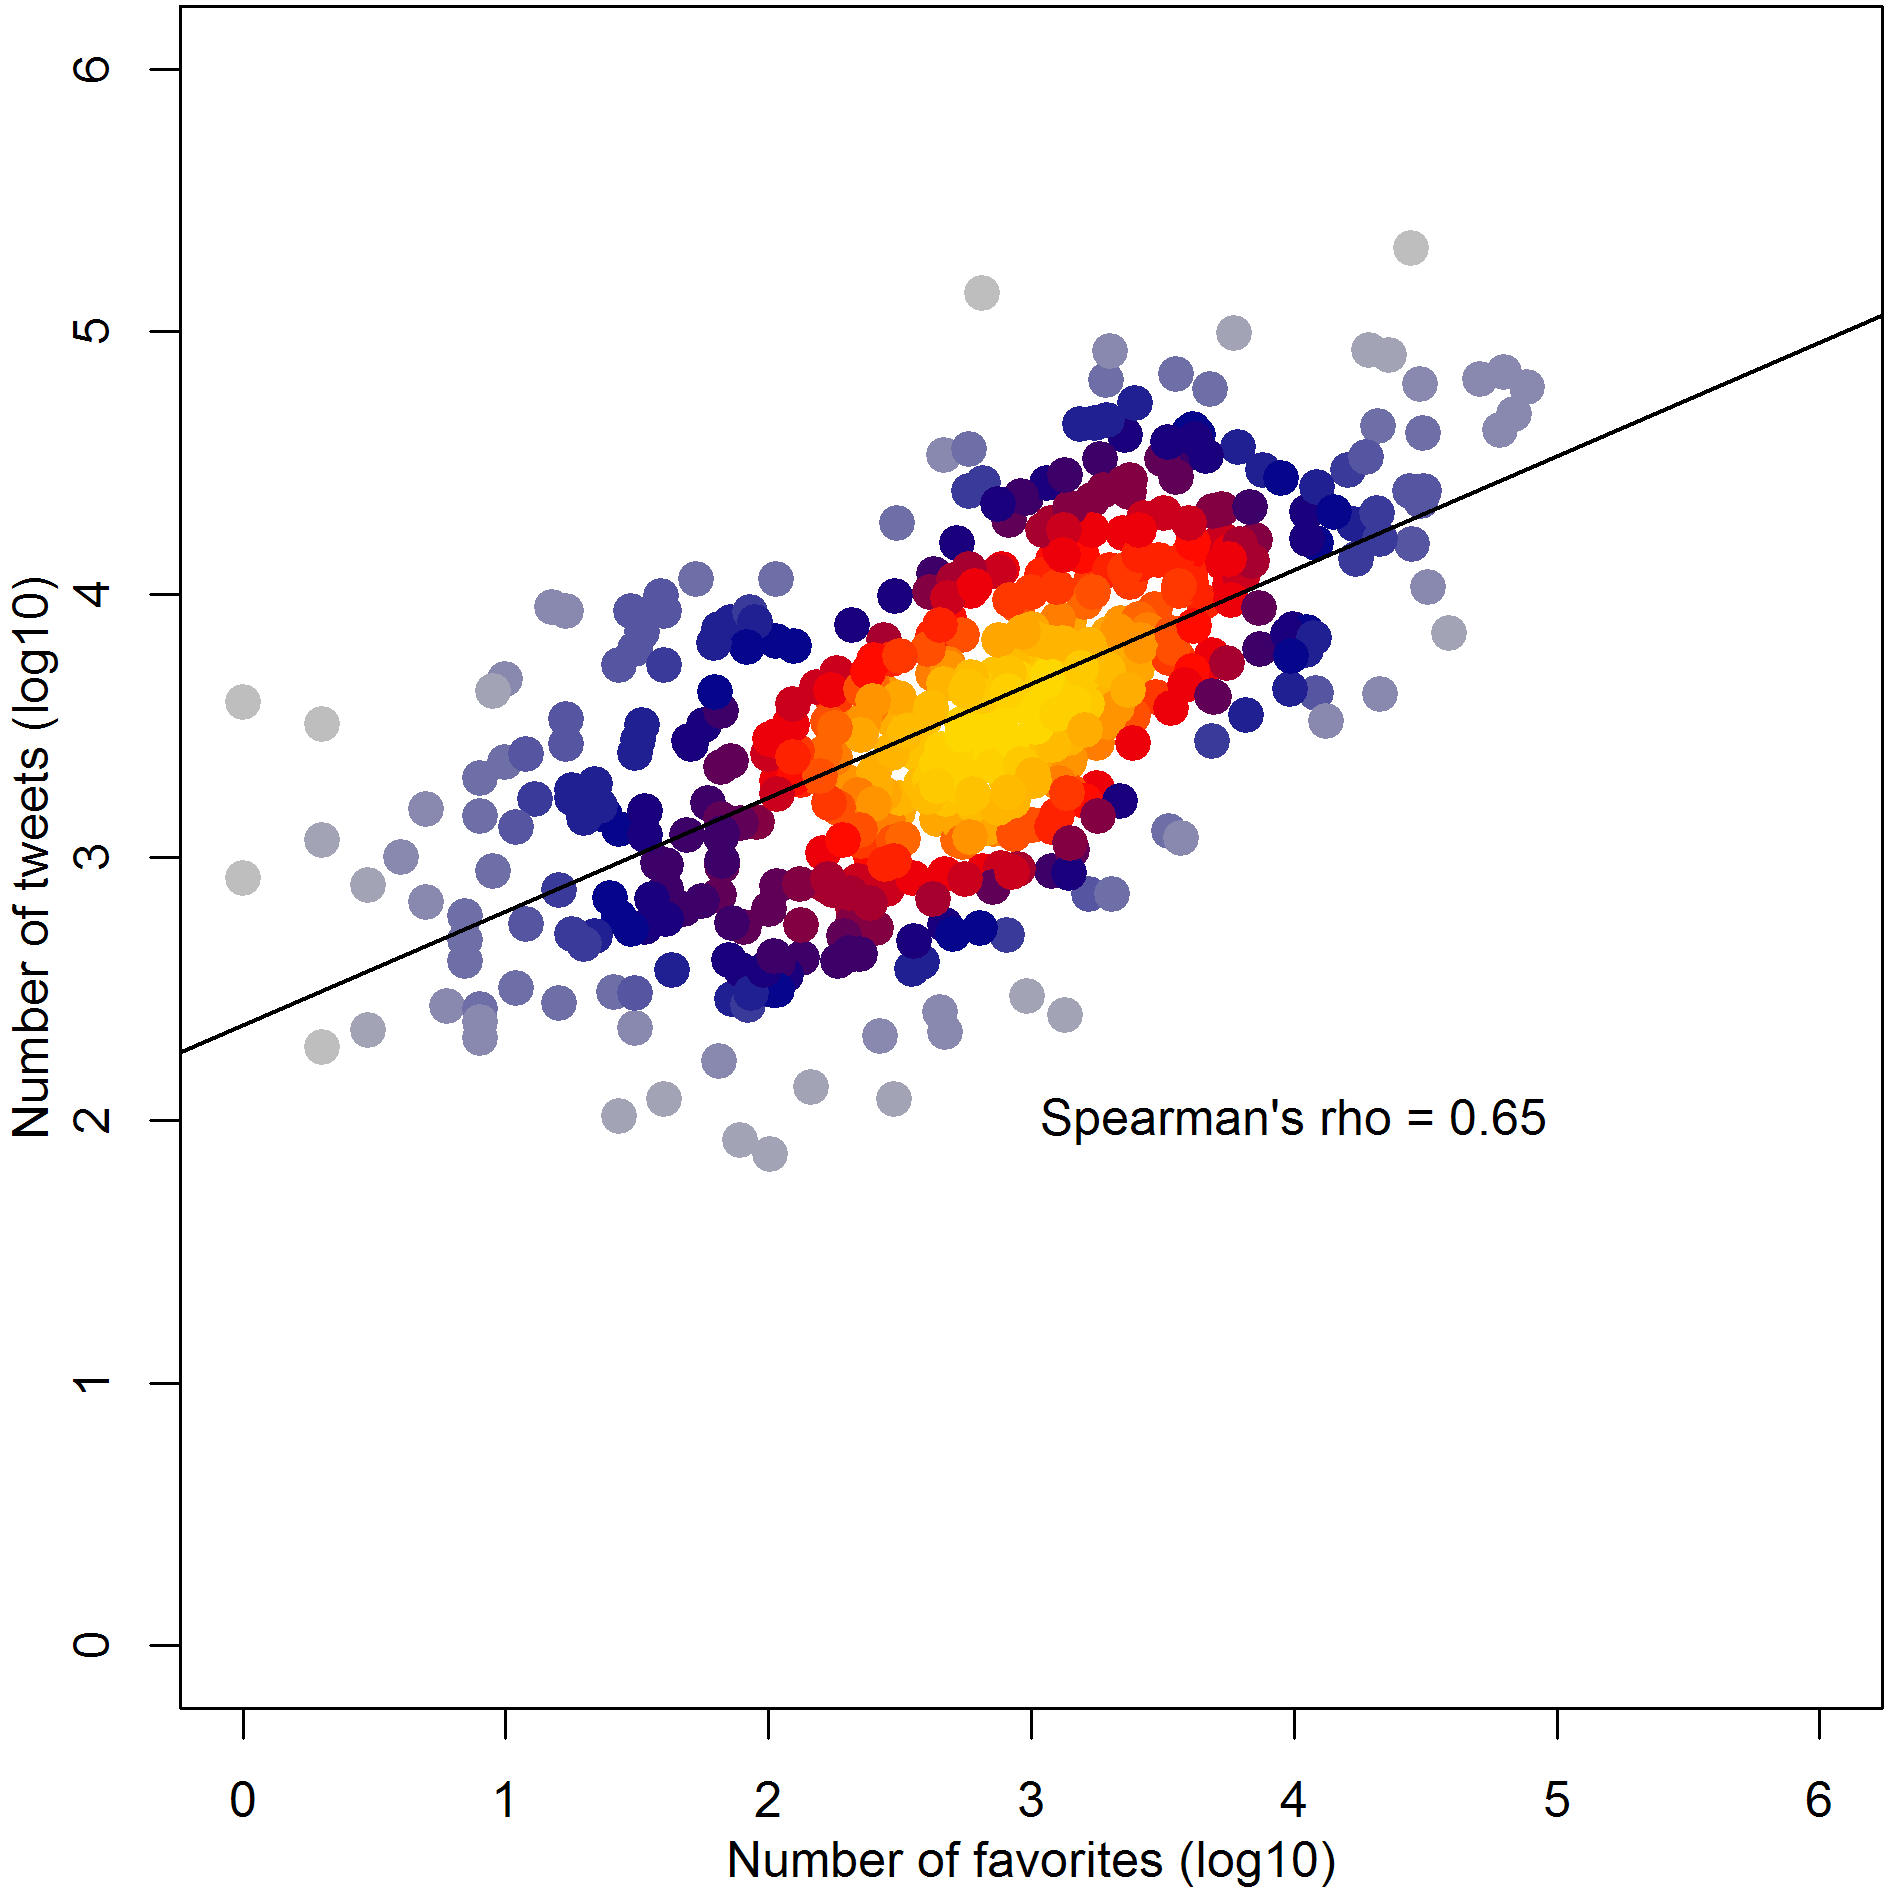
Despite the recent introduction of the heart symbol as opposed to the more ambivalent star symbol, which was met with dismay by some users, favoriting or liking others' tweets is another important form of activity on twitter. Here we see the fairly close association between number of tweets and number of favorites across users in the open science twitterverse. It might be nice to compare these data to the number of hours users spend on Twitter, but for good or ill Twitter doesn't make that level of privacy invasion publicly accessible.
Friends and followers
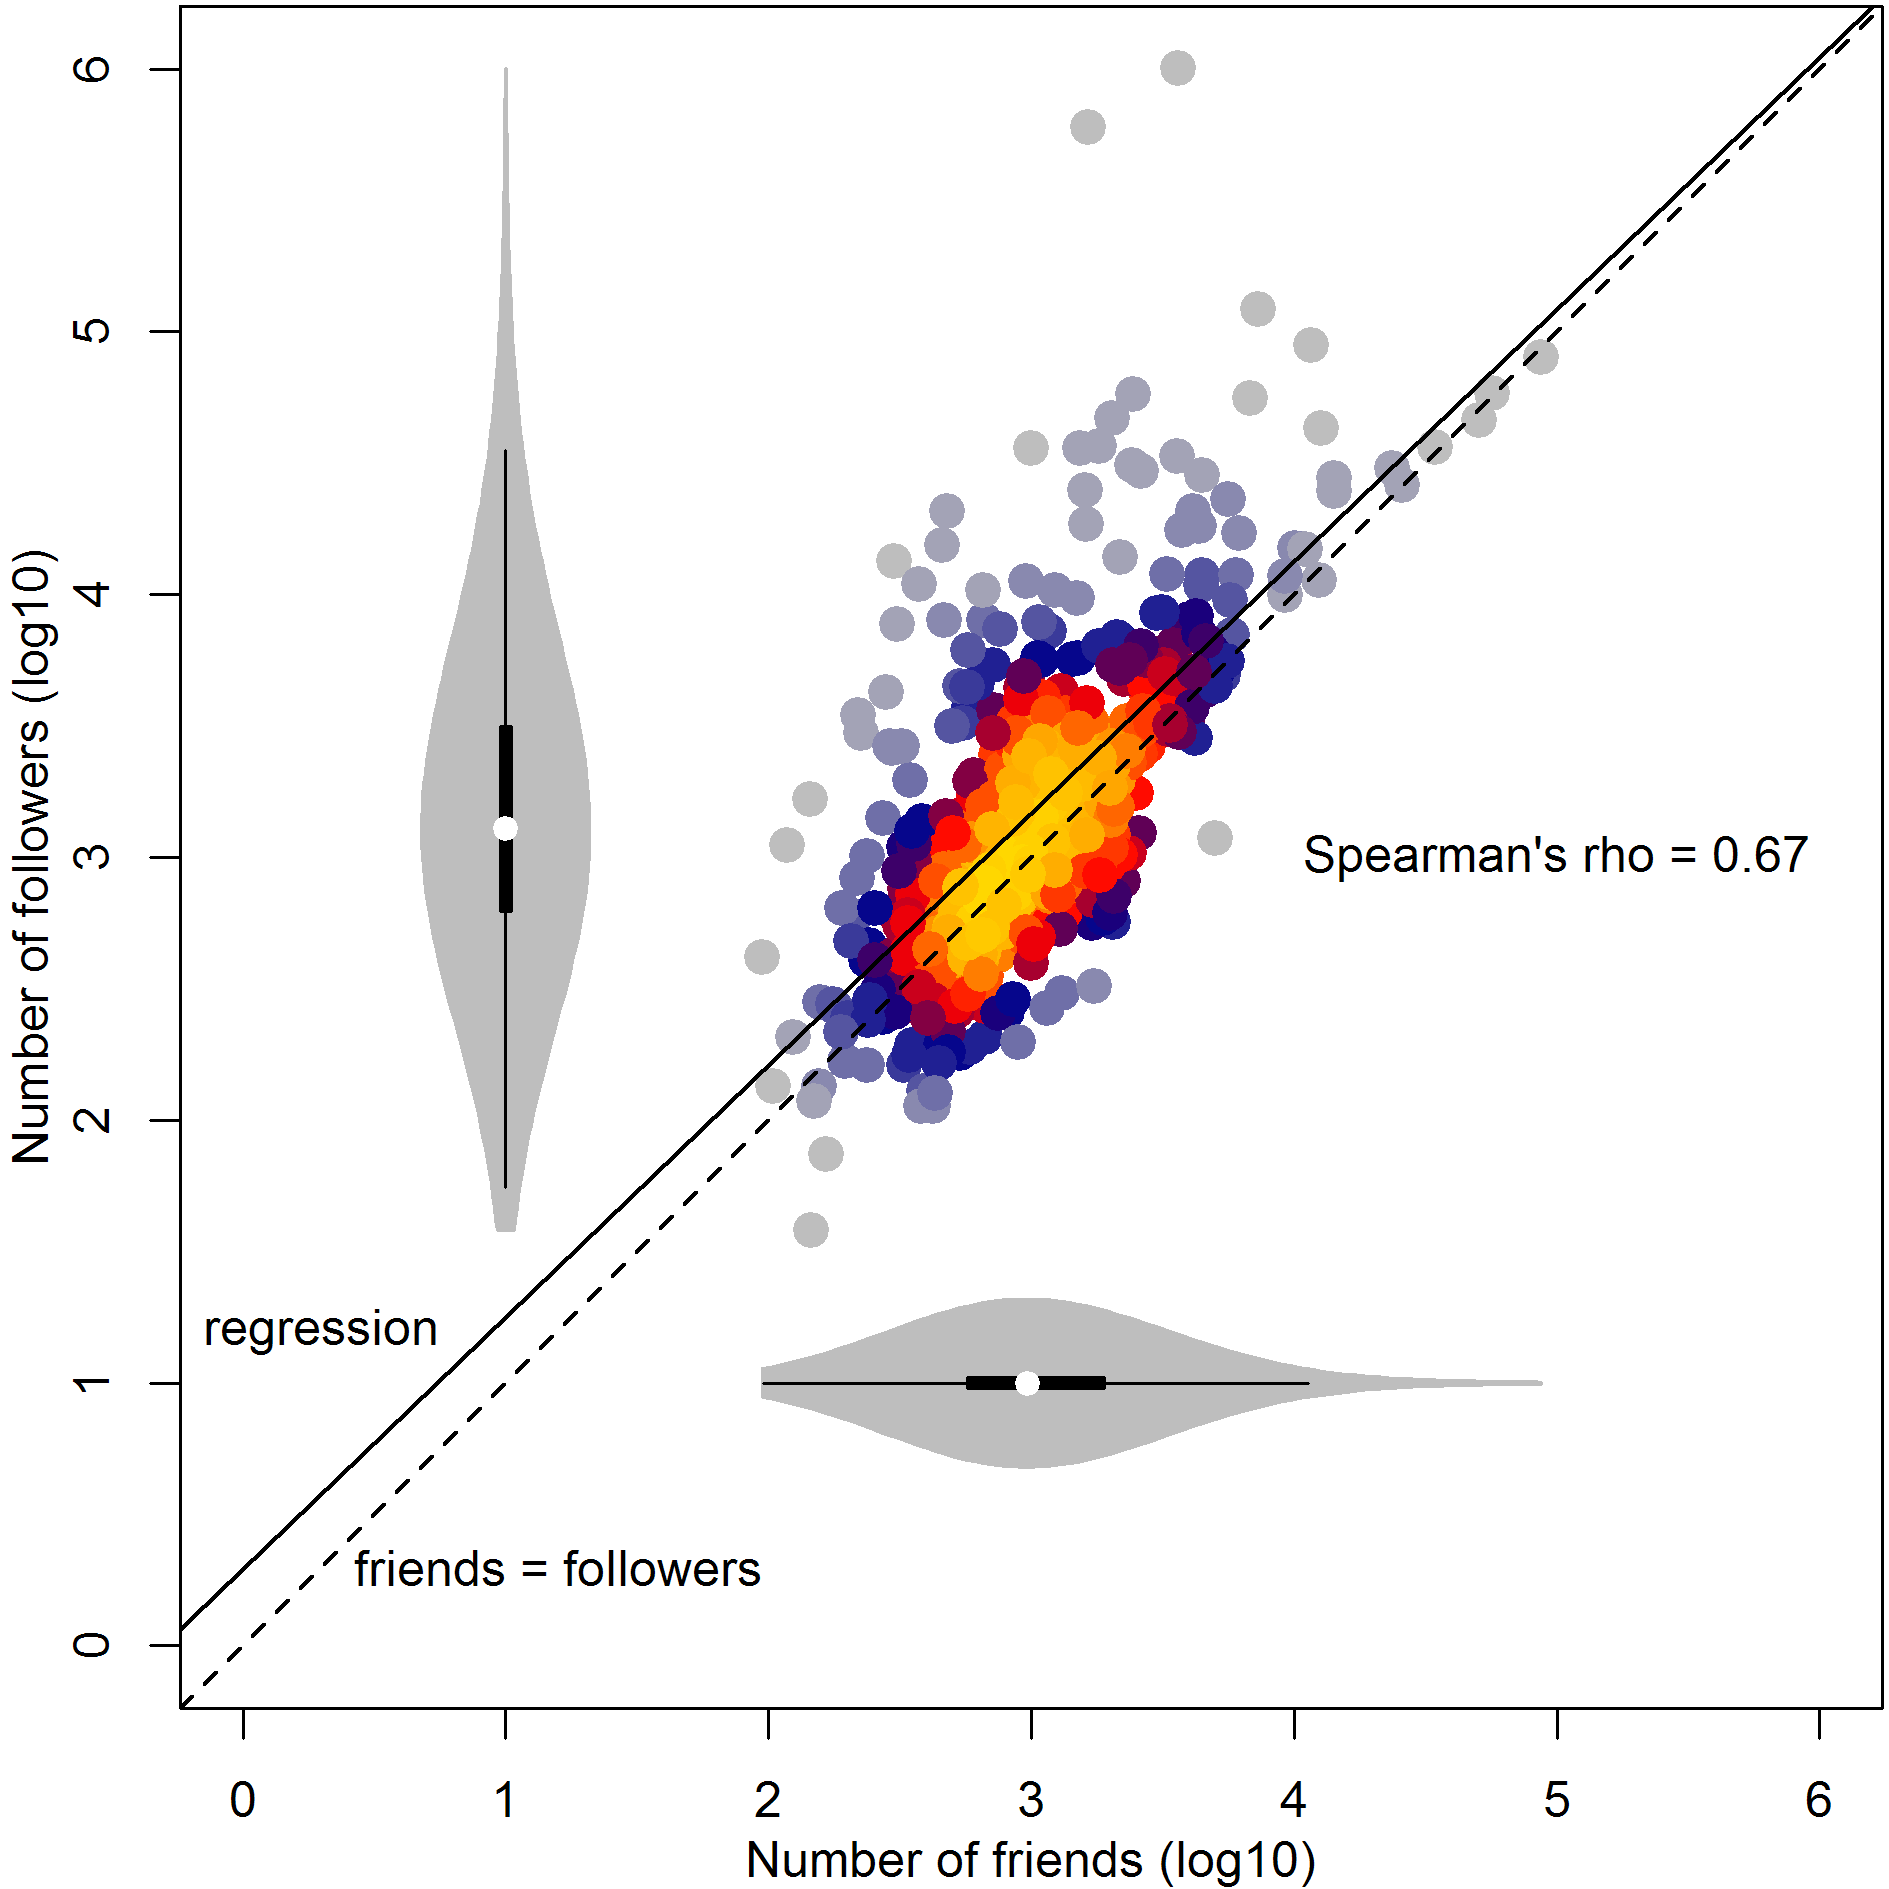
Here we see the univariate distributions (violin plots) and bivariate scatter of friend and follower counts in the open science twitterverse. There is clearly a strong association between the two, hinting at the operation of reciprocity norms. The regression line quite closely approximates the equity line between friends and followers, although in general users tend to have a slightly more of the latter than the former. The median for both variables is around 1000. The largest deviations from equity occur in the forms of a few accounts which follow many people, but are follow by disproportionately many more.
Predicting success
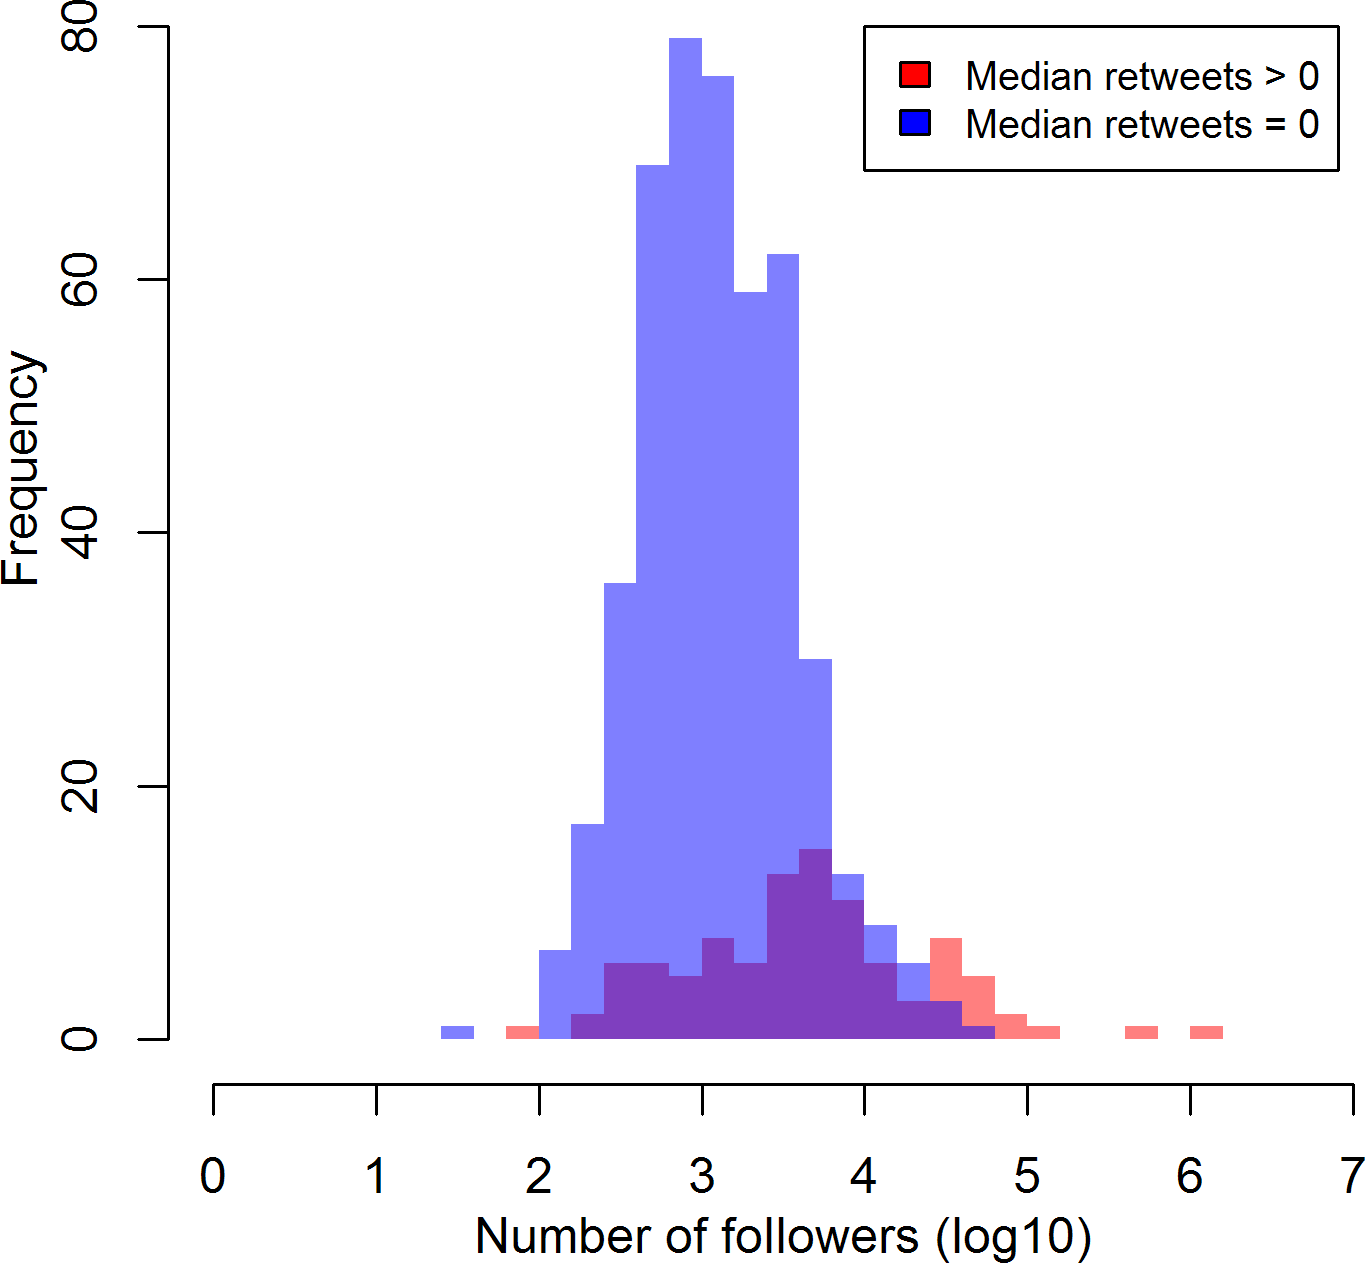
Some might quibble about the applicability of the term "success" to social media, but nonetheless it is worth considering what might predict the ability to spread one's message on Twitter. Number of followers is one clear proxy for Twitter success: having more followers means that more people can see your tweets directly, and that more people may retweet your tweets, spreading them further still. In the plot below, we can see support for the latter assumption, in that those whose median original tweet gets at least one retweet tend to have substantially more followers than those whose median original tweet receives no retweets (82.4% of those in the open science twitterverse).
As we've seen already, the number of people one follows ("friends") is a strong predictor of one's follower count. What other variables might predict number of followers? Below we can see the results of a negative binomial regression predicting follower count with six other variables.
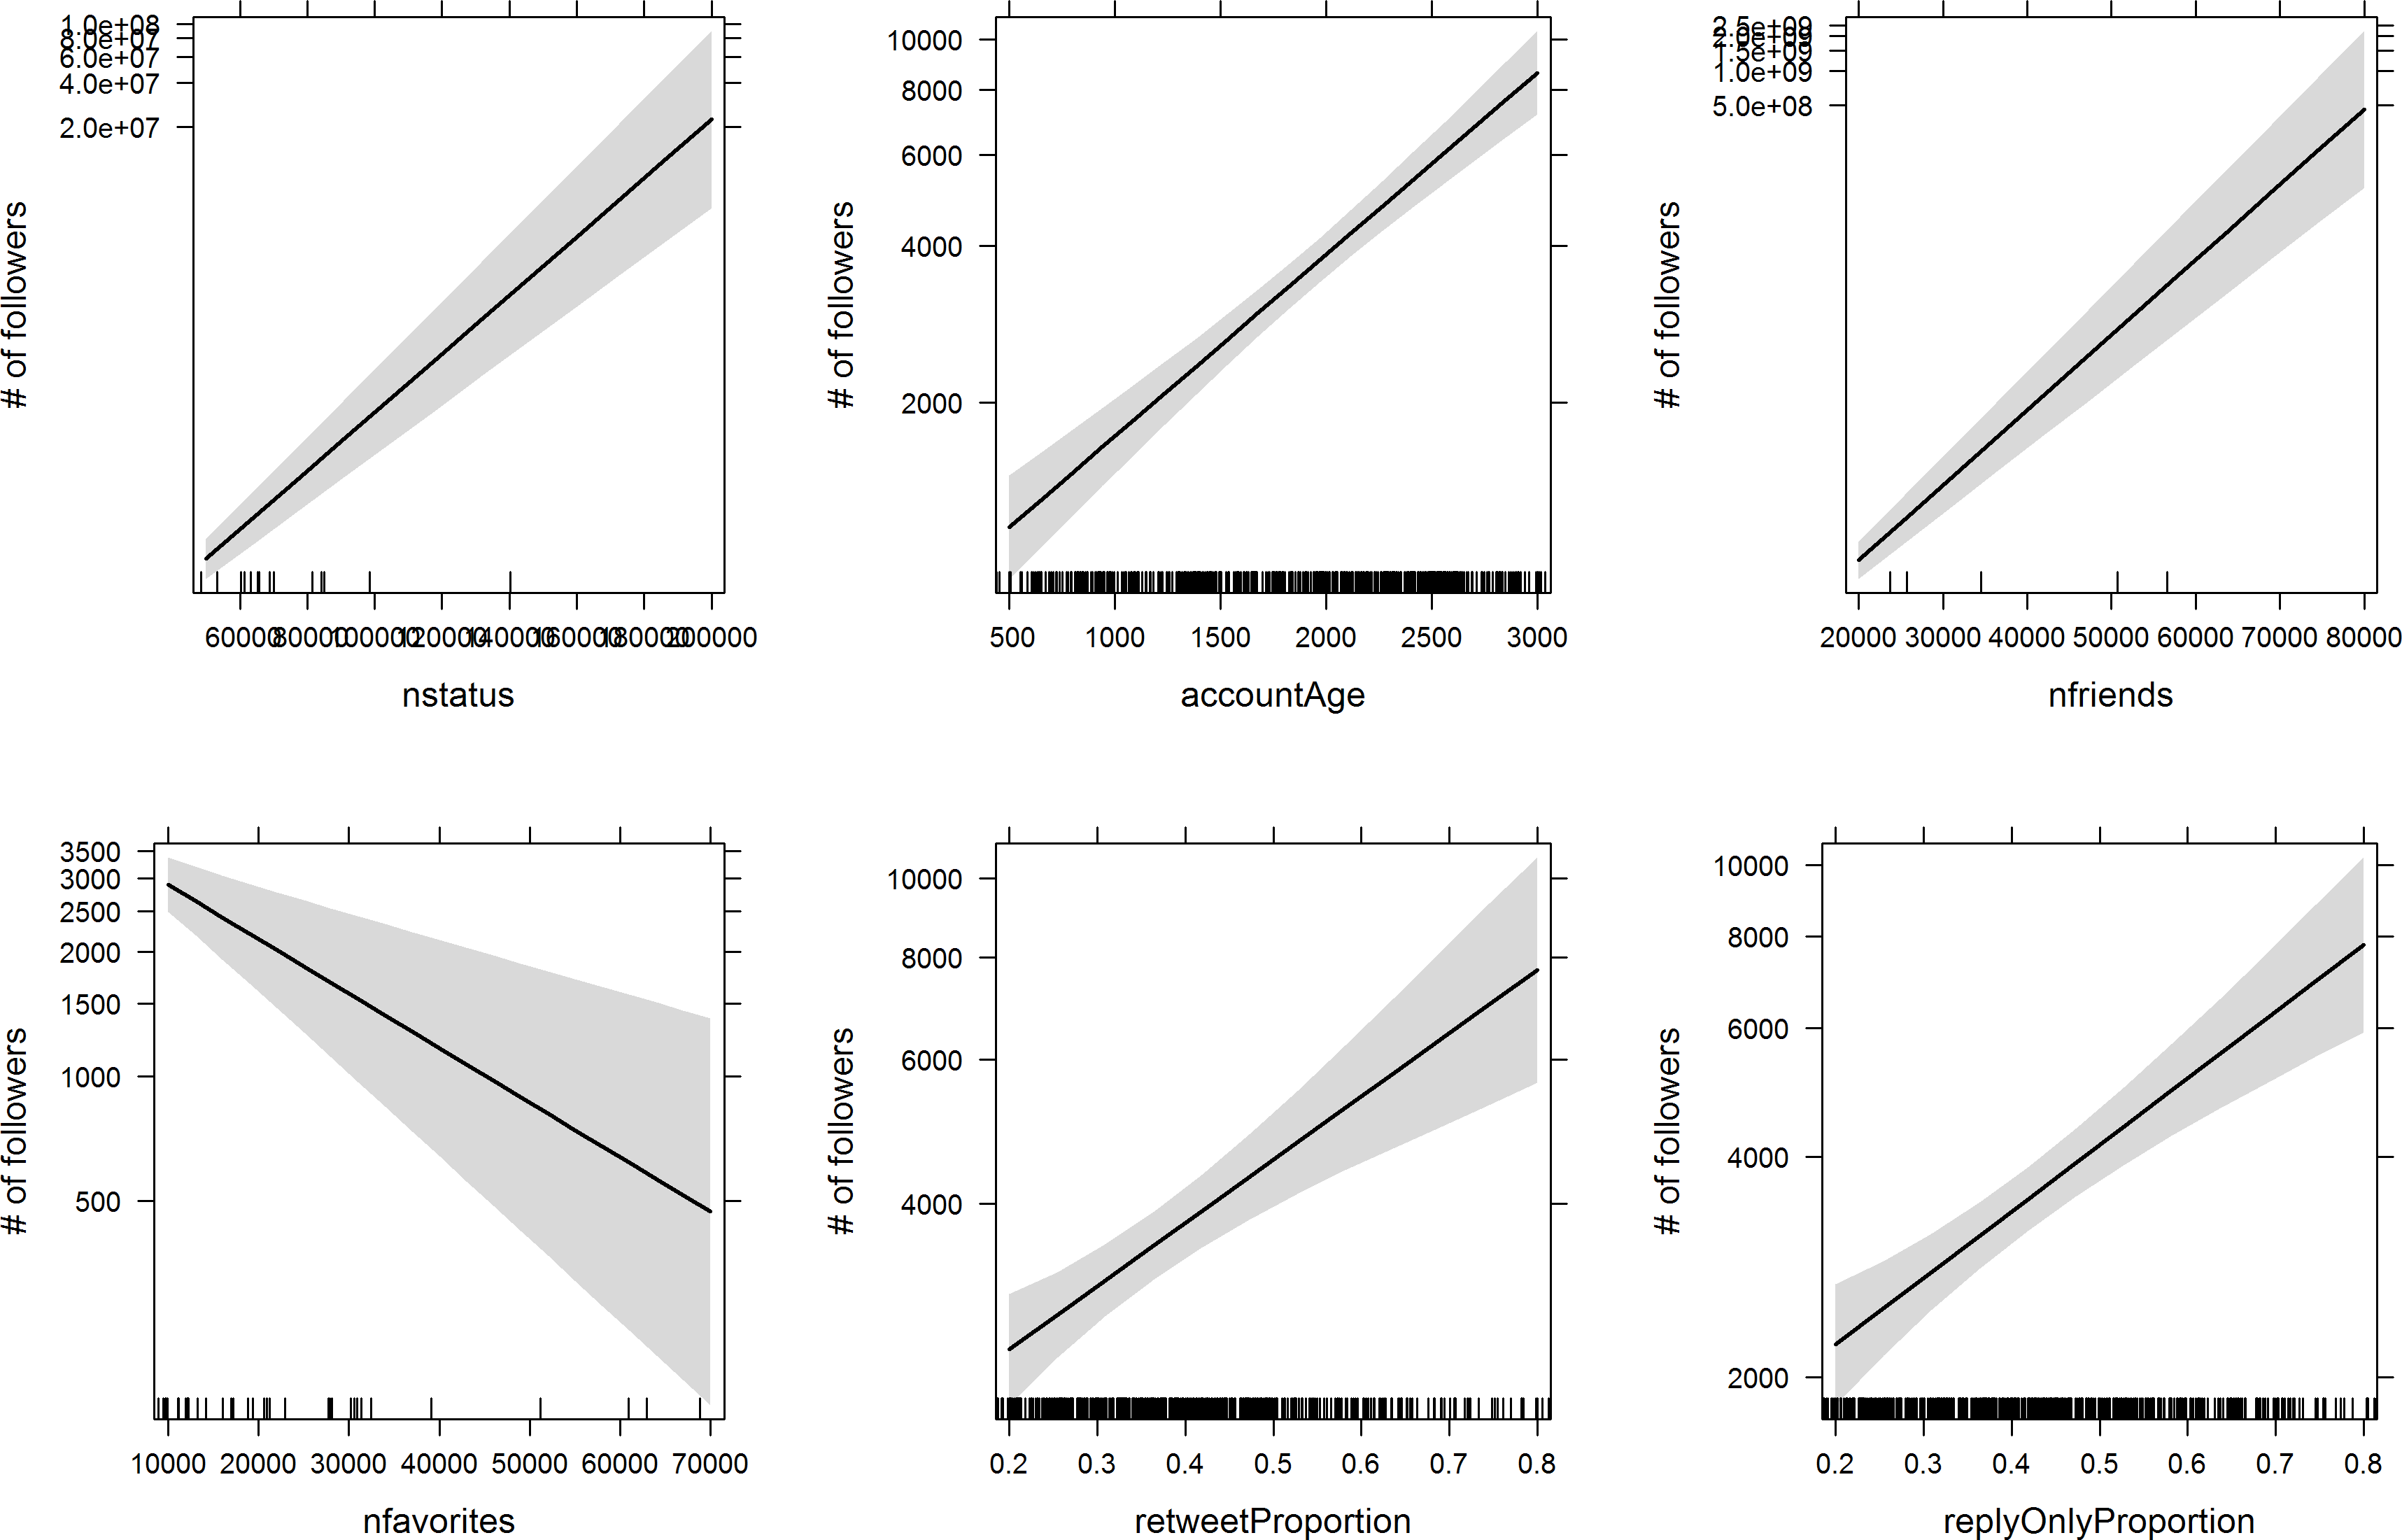
As we can see, number of tweets, account age (in days), number of friends, retweet proportion, and reply proportion all positively predict follower count (all ps < .000001). All else constant, number of favorites was actually a negative predictor (p = .00018) of follower count. Regression diagnostics look reasonable (including VIF, to my surprise) and all the results are still statistically significant (in the same direction) if four severe outliers are removed. Obviously these data are purely correlational, so we can't be sure whether manipulating these variables would cause changes in follower count, but in most cases causal stories seem fairly plausible. Tweeting more, and with types of tweets that directly engage others, seems a like reasonable way to accrue more followers. Following others is a well-known mechanism for increasing follower counts, and is often taken advantage of by marketers. Older accounts naturally have longer to accumulate followers. The negative coefficient of favorite count is a bit puzzling. My first thought is that it may represent an opportunity cost (in cases where people favorite but don't also retweet) which may earn reciprocal favorites but not followers.
Conclusion
I hope you've enjoyed this delve into the world of open science and exploration of its twitterverse. There's still plenty to explore in the data collected for this project - I barely touched the semantic content of people's tweets, for instance - but I think the material presented here represents a decent start. Again, all the code and data from this post are available on the OSF here - feel free to use it, though please be courteous and don't use it to single people out or harass them. If you'd like to follow me on Twitter, you can do so here.
© 2016 Mark Allen Thornton. All rights reserved.
