Postings on science, wine, and the mind, among other things.
Insights About the Job Market from the PsychJobSearch Wiki
Scraping and analyzing eight years of job postings
It's that time of year again: the PsychJobSearch Wiki has just reset. This event unofficially marks the close of the 2017-2018 psychology job market and the opening of its 2018-2019 successor. Thousands of hopeful applicants will be preparing or revising their submission materials over the coming months in preparation for the harrowing experience of trying to find a tenure-track academic job. This year, for the first time, I will be among them. Thus, I will also be among those frequently refreshing the psych job wiki over the coming months, eager to learn which universities will be offering jobs.
Although not the only place to find information on psych/neuro jobs, the wiki is certainly the central hub for such activity, and most postings eventually percolate their way there, even if originally posted elsewhere. The wiki began with the 2007-2008 season, and the format became roughly standardized in its modern format starting in the 2010-2011 season. Each tenure-track job is posted under 1 of 11 different areas (e.g., Clinical & Counseling, Quantitative, or Social/Personality). Each posting includes some basic information: the university in question, the rank and specific area of the job, the deadline for applications, and a link to the full ad on the university website.
The relatively standardized format of these posts makes them amenable to programmatic analysis: with a little cleaning, they are machine-readable. Thus, to gain more insight into the job markets of yore, I scraped the last eight years of the wiki, parsed the text and other information, and conducted a number of exploratory analyses. In doing so, I hoped to provide some concrete answers to a few basic questions:
- How many jobs are there, and in which content areas?
- Which content areas overlap, and to what extent?
- How many jobs are open to early career researchers versus the already-tenured?
- How many jobs are offered by different types of institutions (R1, etc.)?
- When are the applications typically due?
I'll describe the methods at a high level as I answer each of these questions. However, if you're interested in digging into the code and perhaps running a few of your own analyses, you can access it here. Additionally, for those who don't know/like R, I've complied a csv that contains most of the data presented here, for analysis in the program of your choosing. Please note that text cleaning is an inherently messy process, so although I've tried to minimize errors and inconsistencies, there are doubtless a few of them lingering in the data file.
How many jobs, and in which content areas?
Perhaps the most vital statistic when it comes to the job market, is simply "how many jobs are there?" Everyone knows the qualitative answer: too few. However, using the data from the PsychJobSearch Wiki, I could assign a more precise value to this assessment. In the bar graph below, you can see how many job postings were made on the wiki over each of the last eight years. The data are split up by content area, since any given applicant will only be able to apply to a certain set of appropriate jobs.

As you can see, the number of jobs has grown from about 500 in 2010 to well over 700 in the just-concluded season. It is possible that this growth represents a genuine increase in the size of the field, but my guess is that much of it is driven by another factor: awareness of the wiki itself. As people became increasingly aware of the wiki in its early years, more and more postings made their way onto it. However, for the last four years, the number of jobs posted has been relatively stable, hovering around 700.
Zooming in on the individual content categories, we can see that most of these have been remarkably stable over time as well. "Classic" areas like Social/Personality psychology offer almost exactly as many positions as they did nearly a decade ago. Most of the (apparent) growth stems from just two of categories: educational/school psychology, and clinical/counseling. The different areas are also remarkably similar to each other in size, with none differing by as much as an order of magnitude: unusual for count data. Social, developmental, and neuroscience each offer ~80 jobs per year; there are about 60 jobs per year in cognitive and another 60 open area; education has grown from 0 jobs on the wiki to 86 last year; clinical has grown from 100 to 156; and quantitative, health, and I/O all consistently offer somewhere in the mid 20s.
Note that, for this and all subsequent analyses, I only examine tenure-track jobs. This is partially due to personal interest: I'm applying for such jobs, so this is the part of the job market which most interests me. However, it's also because the non-tenure-track job postings (and postdoc postings) are less consistent in both substance and formatting, which would make it much harder to interpret any results from analyzing them.
How do content areas overlap?
The analysis above gives a basic answer to the question of how many jobs you might be able to apply for in the coming season. However, the categories used by the wiki are too broad. For example, a memory researcher would fall squarely under the heading of "cognitive" but not every posting under this heading is appropriate for a memory researcher. Moreover, many researchers work at the intersection of two or more of these content areas. As a social neuroscientist, I'm a good example of this: my work is at the intersection of social psychology and cognitive neuroscience, with the latter being just a subset of the "neuroscience" category on the wiki. Thus, I could likely apply to a fair number of jobs in both categories, but there are also bound to be quite a few jobs in each category that would not be appropriate for me (e.g., an animal neuroscience job).
To address these issues, I conducted two additional analyses of job content area, with the aim of assessing the similarity and overlap between the different areas. The first analysis in this vein was a correspondence analysis. For those unfamiliar with this technique, you can think of it as conceptually similar to the more familiar technique of multidimensional scaling (MDS). In MDS, you provide a distance matrix between a set of "objects" and the algorithm attempts to fit then all into an N-dimensional (where N is usually 2) space that accurately represents the distances between them. Thus, if you fed in distances between major US cities, you'd end up with a reasonable map of the US. Correspondence analysis is similar, except instead of distances, you feed in counts. In this case, each "object" is one of the 11 different content areas, and the counts represent how many times each of about five hundred words occurs in each category. The words themselves represent all of the reasonably frequent words in the postings, with the exception of things like numbers, punctuation, and grammatical (stop) words. Additionally, all of the words have been "stemmed" to reduce them to their roots.
You can see the resulting joint configuration plot in the figure below. Unlike most MDSs you've probably seen, this joint plot features both the content areas (red) and the words which occur in them (blue). Including the latter aids in the interpretation of the former. The more often a word occurs in any one category in particular, the closer that category label is to that word. As a result, content categories that feature similar word profiles are also systematically closer to one another in the space. Due to the high number of words, I have cherry-picked only a few illustrative cases for labelling. Additionally, I noticed that by a happy coincidence the content categories are shockingly well fit by the Greek letter psi (the traditional symbol for psychology) so I've added the letter to the plot, just for fun! As in an MDS, the axes are arbitrary.
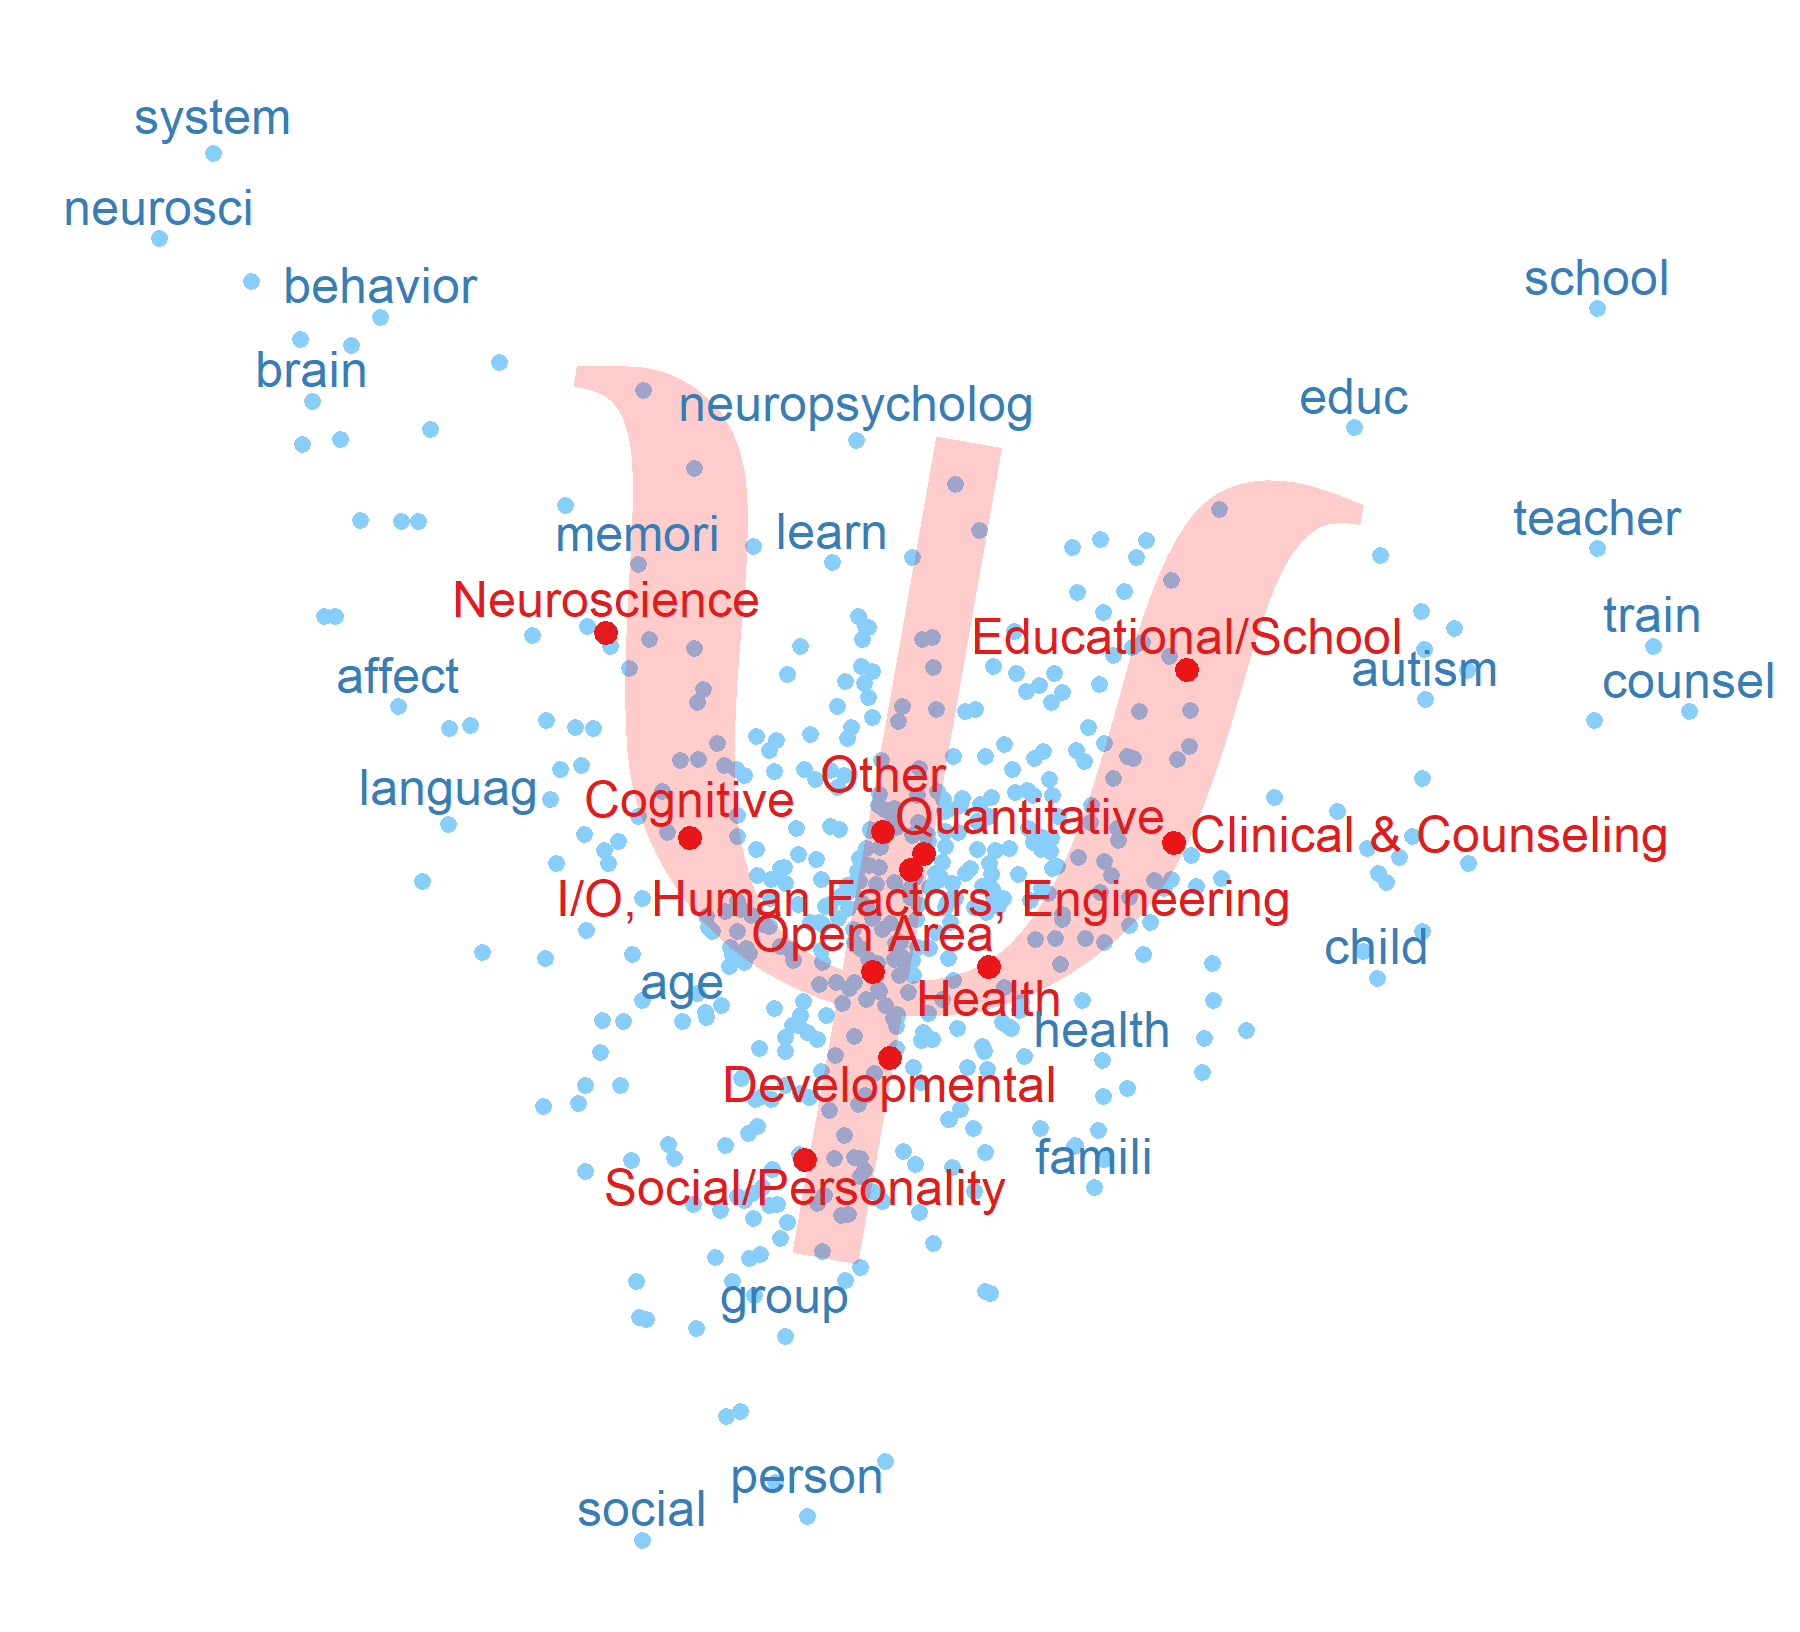
The results of the correspondence analysis are remarkably clear. They suggest that the job postings are divided into three main "arms" radiating from the center. The left arm represents neuroscience, and to some extent cognitive psychology; the right arm represents applied psychology, in the form of educational/school psychology and counseling (though interestingly, not I/O); and the bottom arm represents social/personality psychology, and to some extent, development. In the center, we see the two generic categories - "Open Area" and "Other" - as well as quantitative, health, and I/O psychology.
The placement of the words sheds further light on this placement. A number of highly appropriate terms feature at the end of each arm (e.g., "social" and "person-" on the lower arm). However, the terms on the edges between arms are perhaps even more interesting. For example, between the neuroscience and clinical arms, we see neuropsychology, just as one would expect. The word "family" appears between the social and clinical/educational arms, again reflecting its importance to both. The placement of affect and language between cog/neuro and social/personality arms is also very interesting.
These results indicate that, despite using 11 content categories, the job ads on the wiki really only reflect three broad content areas. These results also suggest that content greatly overshadows methodology when it comes to the short job descriptions posted to the wiki. This explains why quantitative psychology - which describes an orientation towards methods, rather than any particular content - ends up in the center of the graph, closely clustered with the more generic content categories.
So, should we infer from this result that one can apply to any job in the appropriate arm of the correspondence analysis? Probably not. Although this analysis tells us a great deal about the similarity between areas, we must be cautious about generalizing this back to the level of individual job postings, at the risk of committing the ecological fallacy. That is, from the result above, we cannot tell whether *each* cognitive job looks a bit more similar to *each* neuroscience job, or whether there is some subpopulation of jobs for which there is total overlap and another subpopulation for which there is none. We may have reasonable a prior about this, but why rely solely on it when data is available?
To get a grip on the degree of overlap between areas at the level of individual job postings, I searched through each posting for mentions of the four major "pure" content areas: social, cognitive, neuroscience, and developmental. Another reasonable approach would have been to examine explicit cross-posting, but that practice is followed inconsistently, and so I took the lexical approach instead. Naturally not every posting included any one of these, and for the present purposes I excluded those postings which featured none of these terms. I then computed the Venn diagram reflecting the overlap between the four words across the remaining postings. The graph below reflects the proportion of posting that contains each word or combination of words. Note that unlike a 2-category Venn diagram, the area of this graph does not reflect anything about the data.
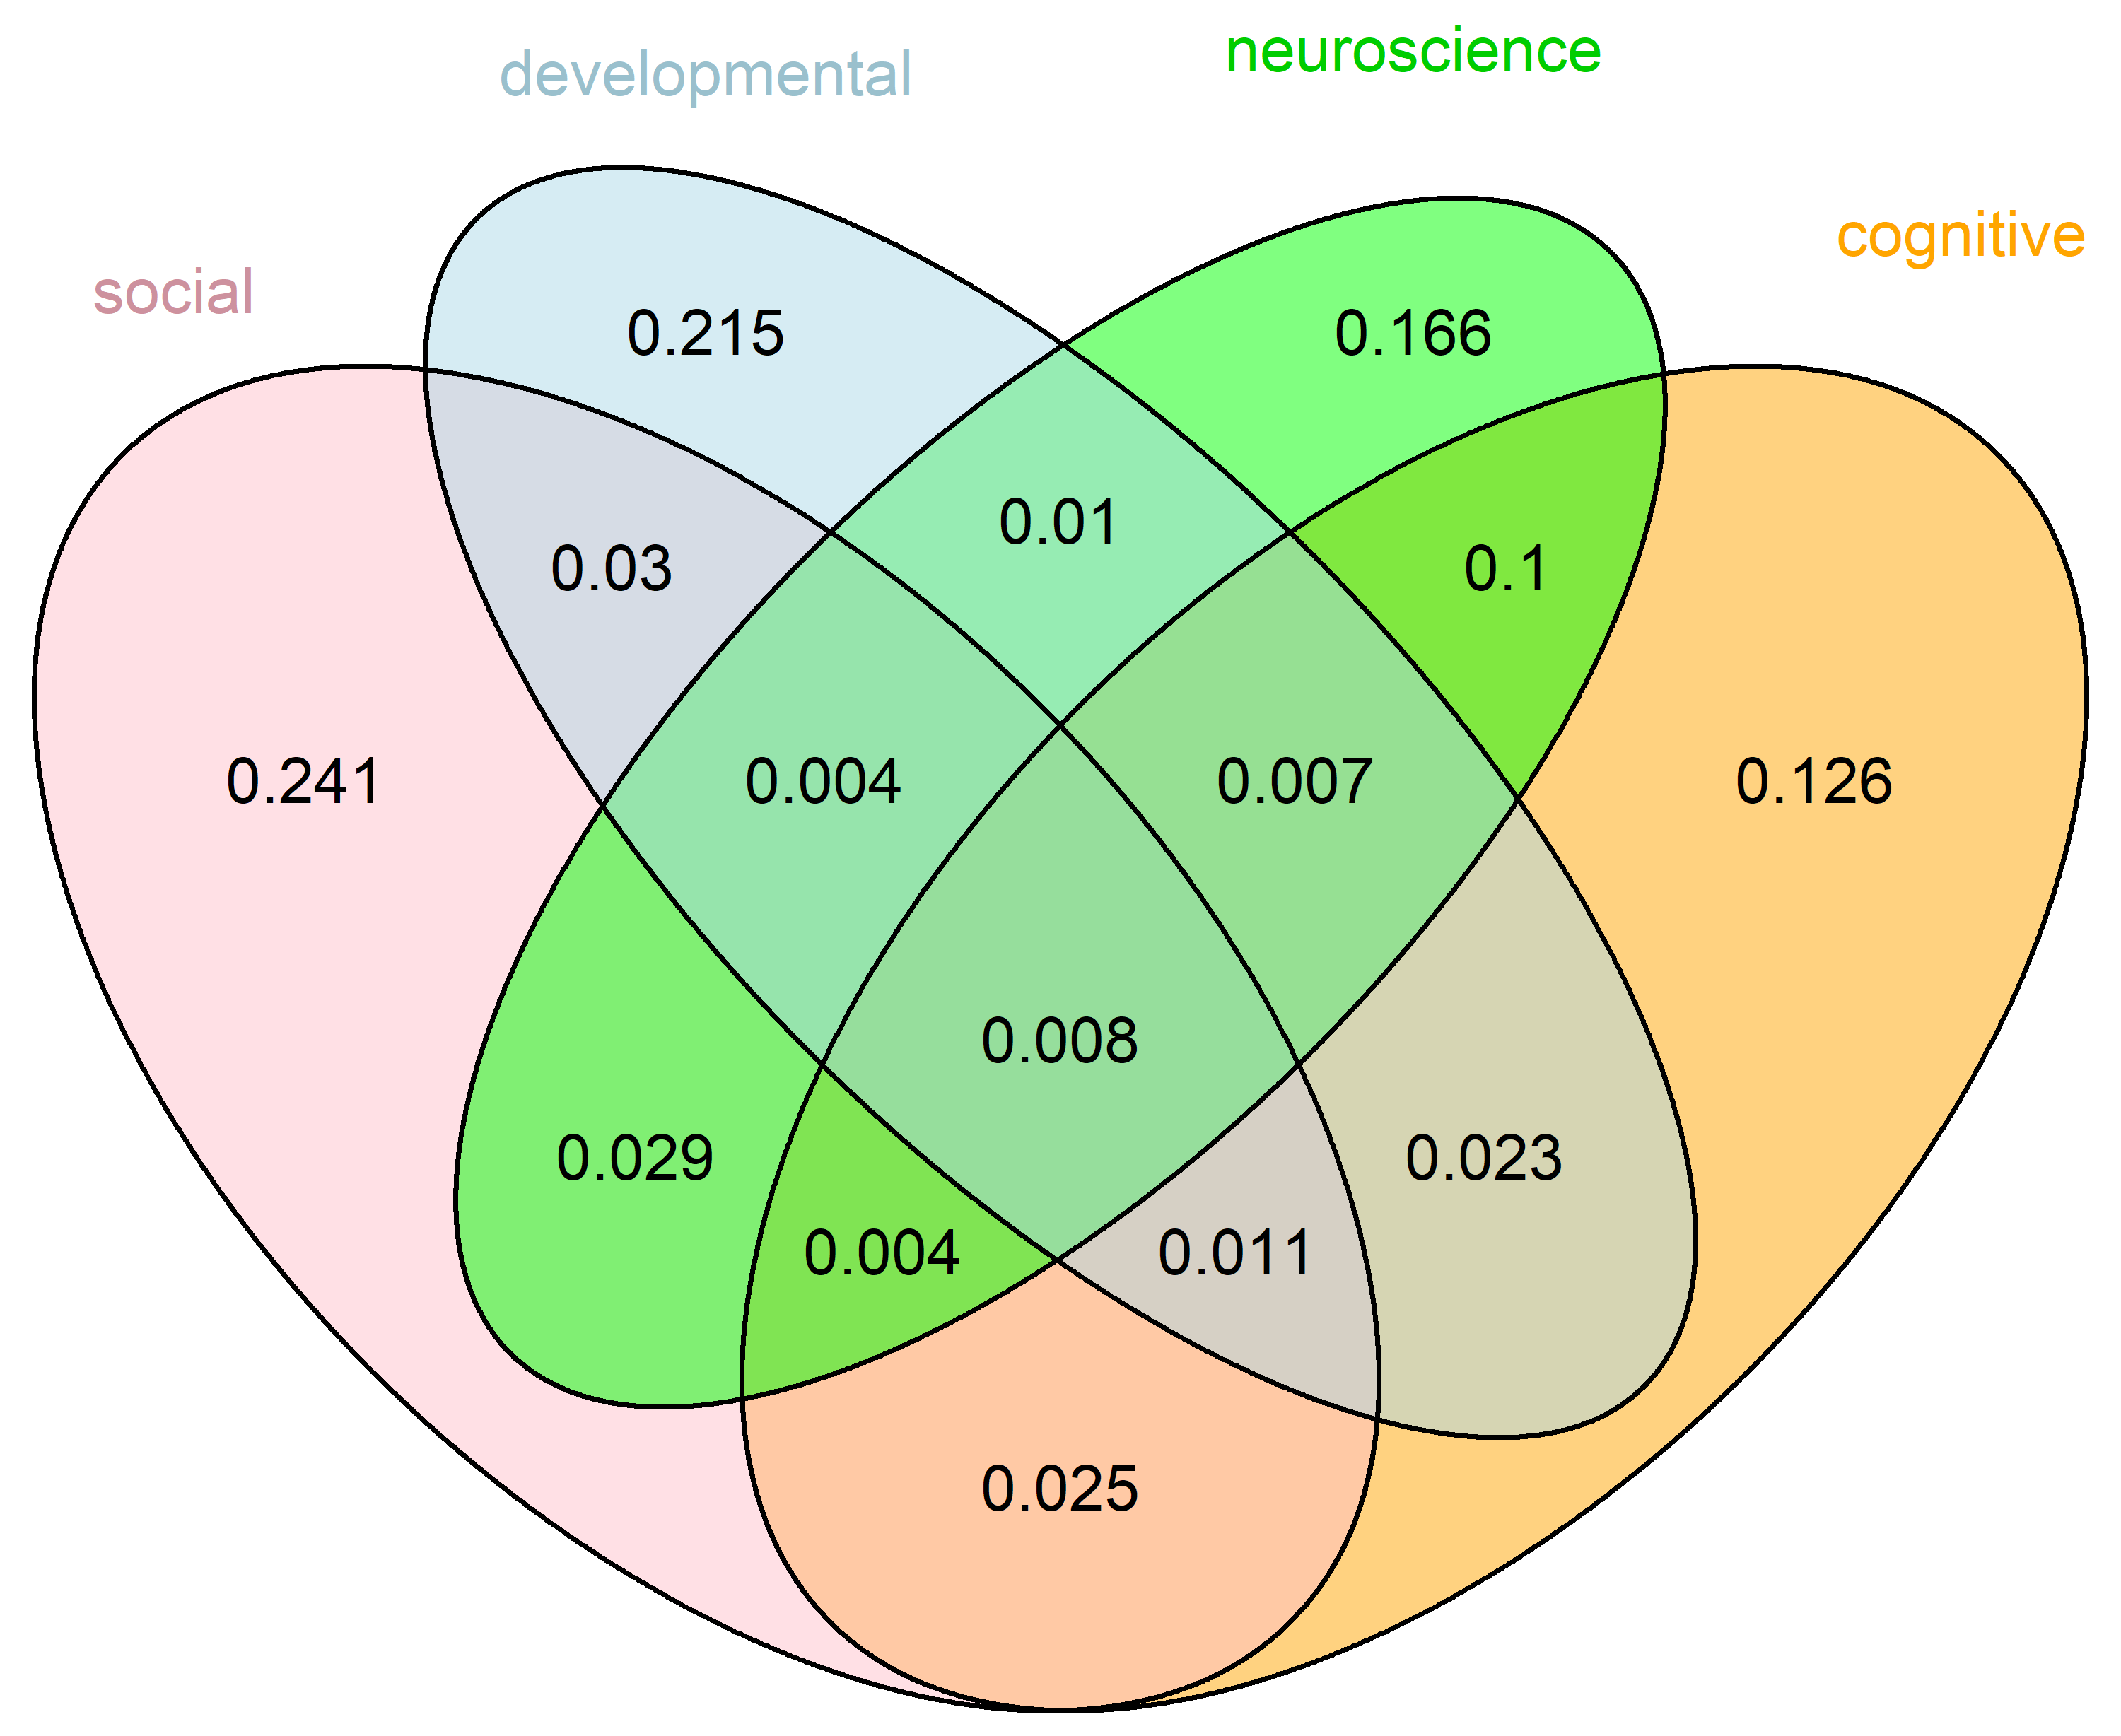
As you can see, the overwhelming majority of jobs (more than 3/4ths) specify one and only one of the four areas. However, at the same time, there are more jobs that specify two or more areas than that specify any single area. The largest area of overlap is between cognitive and neuroscience, no doubt representing the field of cognitive neuroscience. The overlap between these two categories accounts for about 12% of all jobs examined. Of these, most result from the exclusive overlap of cognitive and neuroscience, without including social or developmental hybrids. Social neuroscience is rather smaller, accounts for or 3.5% of jobs inclusively, or 2.9% exclusively. Social cognition, cognitive development, social development, social cognitive development, and developmental neuroscience are each also relatively well represented, accounting for >1% of jobs each (exclusively). Interestingly, the least common category of (exclusive) overlap is not the full four-area combination, but social cognitive neuroscience. This is likely because this term is generally used synonymously with social neuroscience these days, so people tend to prefer the less wordy alternative.
What's the early-career/tenured split?
Content area isn't the only major factor that determines whether you can apply for a job. Another major factor is the rank at which it is advertised: it would be ill-advised to apply for a full professorship in one's 6th year of graduate school. Getting a tenure-track job is the "Great Filter" of the academic universe, so it's safe to assume that there are more early-career researchers (ECRs) applying for jobs than tenured professors, but what's the exact split? You can see the answer in the graph below:
The overwhelming majority of jobs in a given year - nearly 500 on average - are at the level of assistant professor (only). Note that assistant rank is the *explicit* default on the wiki, hence why the two categories are divided ("assistant" for postings which explicitly mention this rank, and "assumed assistant" for postings which mention no rank). In addition to jobs offering only assistant professorships, there are also quite a few jobs that are "assistant or associate" or "open rank" meaning that they would also be viable places for ECRs to apply. The number of tenured positions is much lower, likely because most of these positions are filled by promoting from within. The "lecturer" rank is a special case: this rank is not typically tenure-track in the US, but these jobs were all listed as tenure-track, thus suggesting that they likely originate from the UK or other nations on a similar model.
What kind of university are offering jobs?
Another factor which might influence whether you want to apply for a job or not is the status of the institution. Some people want to focus on research, and typically gravitate towards the universities which are commonly recognized as the best research institutions. Other people may want to focus on teaching, and might thus prefer to find a job at a liberal arts college. What faction of the jobs on offer originate at different types of institution? It's difficult to know this from the wiki data alone: postings typically don't list any information about the institution beyond its name. To solve this problem, I scraped a list of the R1, R2, and R3 schools from Wikipedia. I then cross-referenced this list with the job postings on the wiki. The process wasn't quite perfect - I was only able to match 260 out of the 334 institutions on the Wikipedia list - but I think the results are still informative:
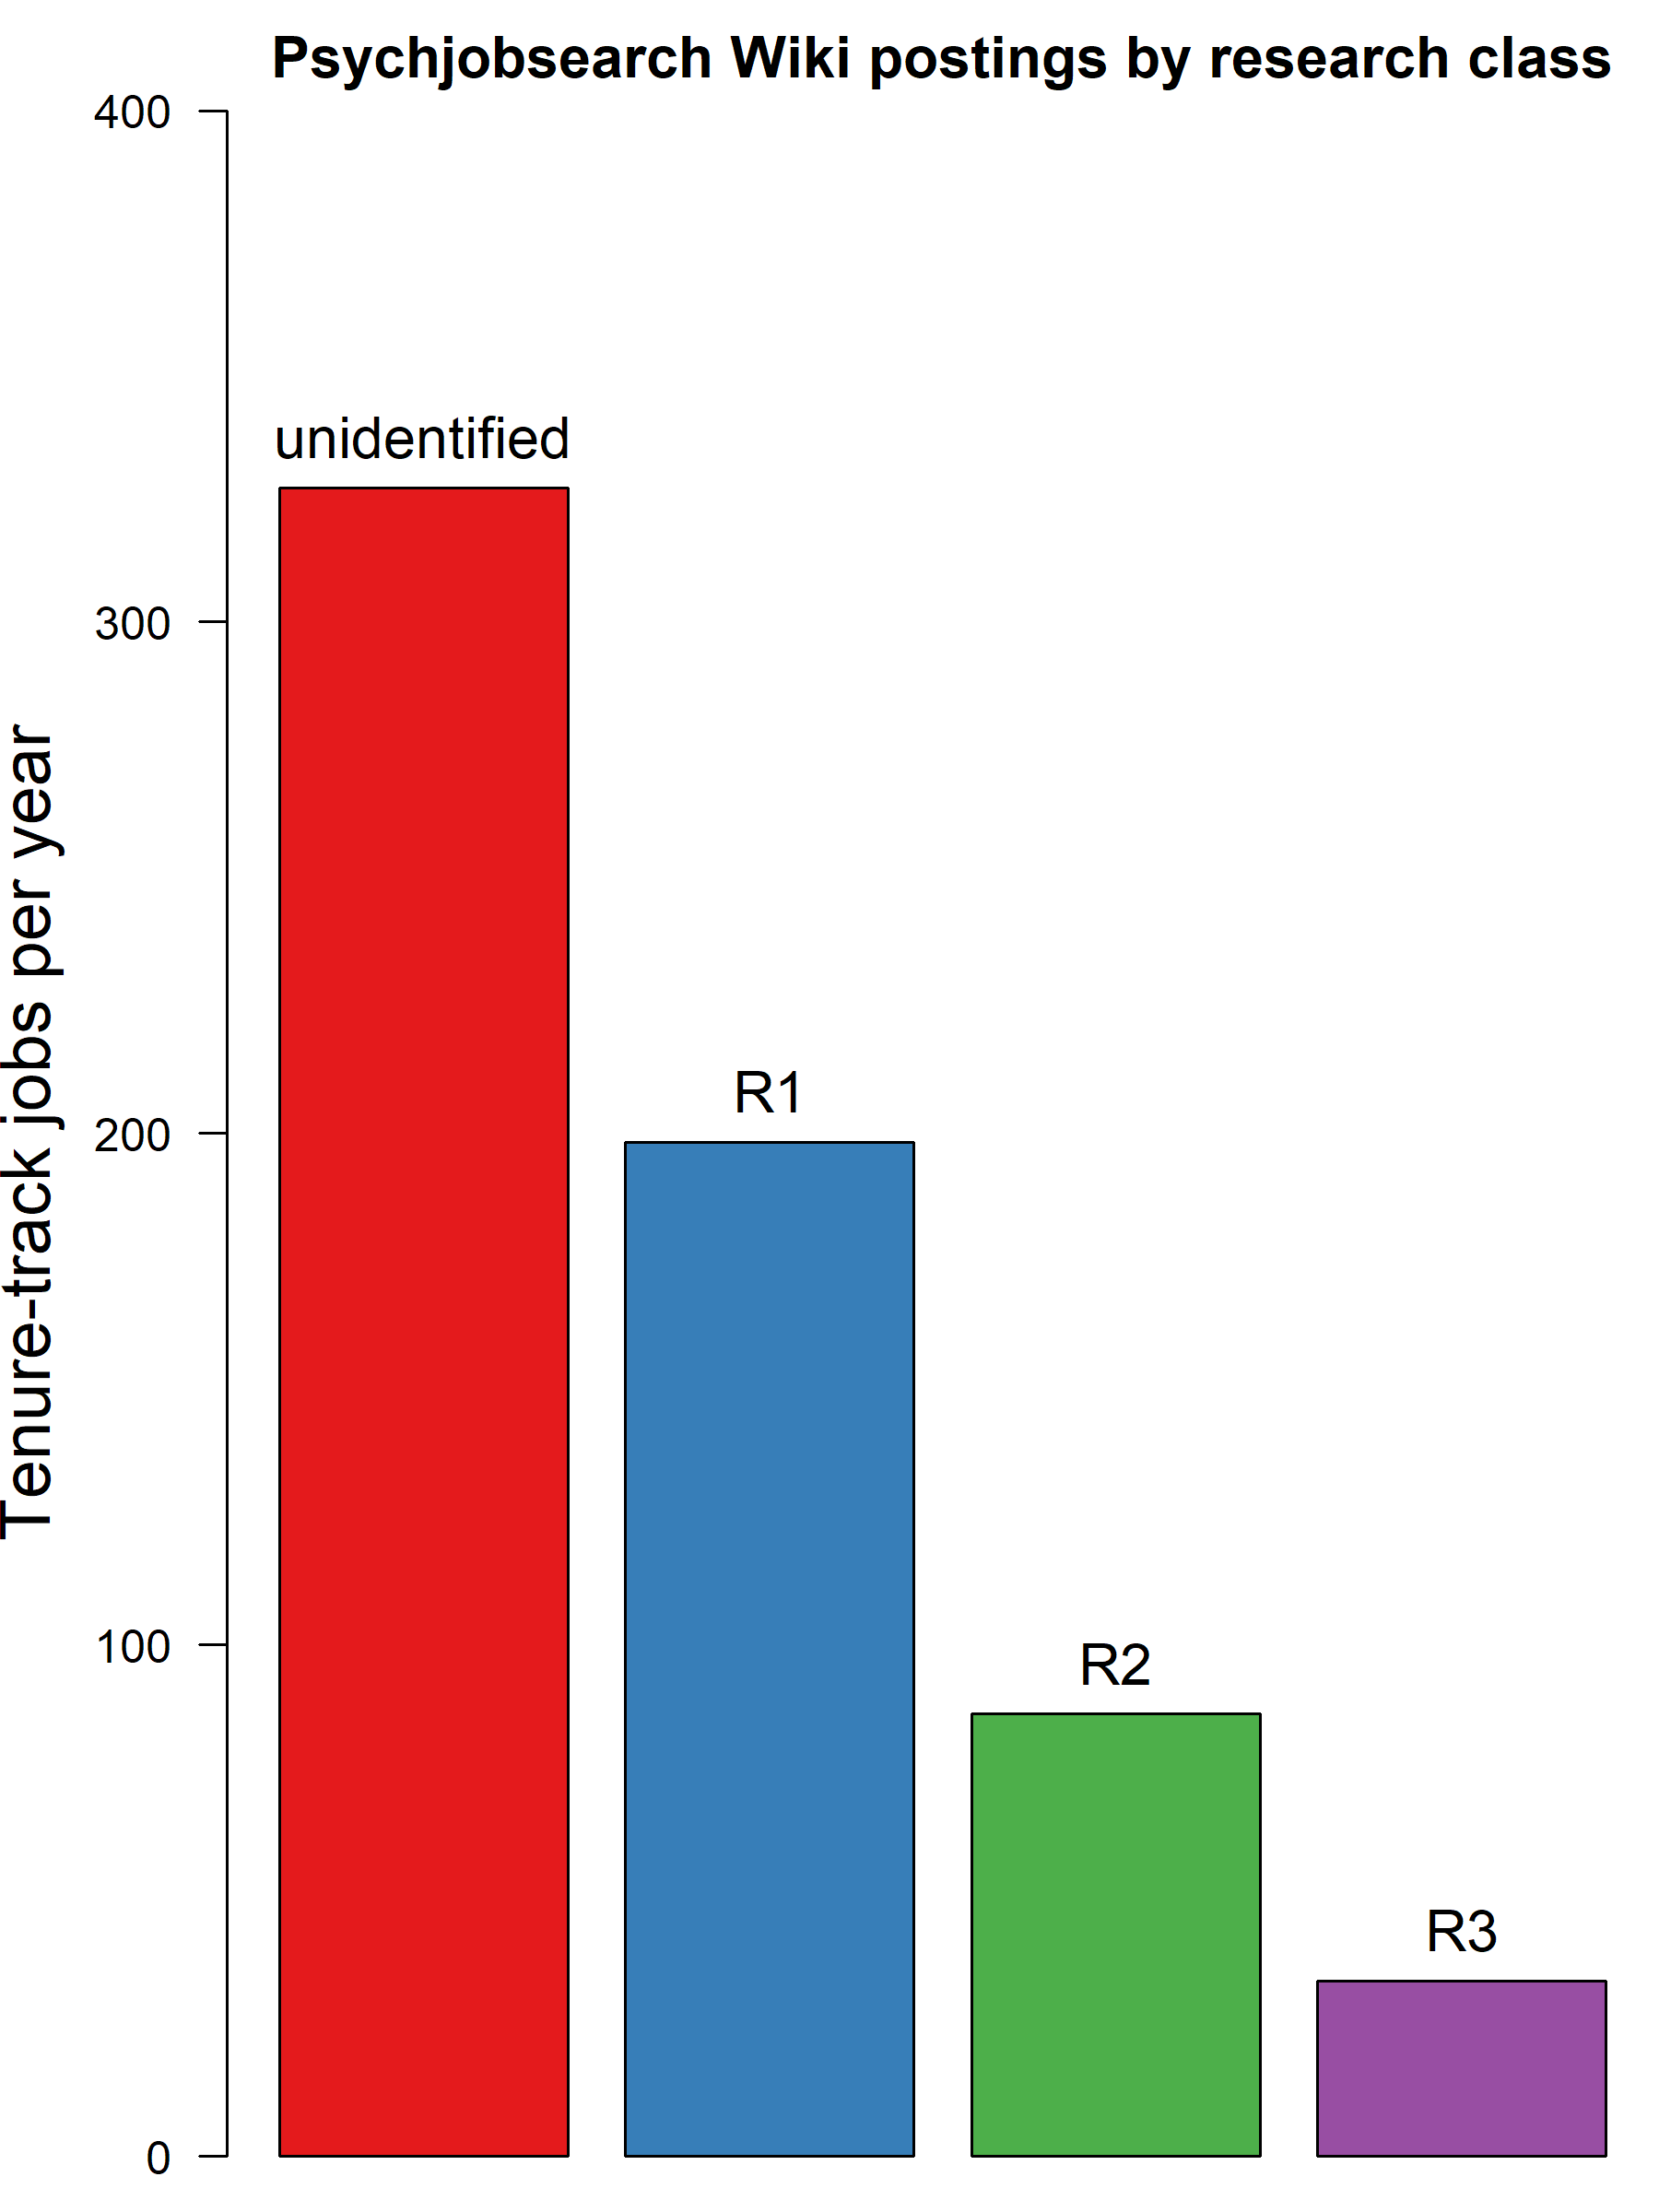
The plurality of job postings - over 300 per year on average - originate from unidentified schools. Due to imperfect matching, some of these might be research universities, but the majority are likely liberal arts colleges or other universities that are not research-focused. R1 schools offer the next largest number of jobs, at around 200/year. R2 and R3 schools between them only offer a bit more than 100/year. This isn't great news for people like me looking to land an R1 job: only about a third of the total listed each year come from this category of institution. Combining this with the area and rank divisions we've seen in the preceding sections, and you start to get a picture for why the academic job market can be so stressful: there are often only a handful of jobs that would perfectly fit a given applicant. Of course, that's not even considering the question of location: one analysis which might be "fun" for the motivated reader would be to cross-reference the wiki data with city or state location information on each university.
When are applications due?
The final question I'll consider in this post is about timing: specifically, when do you need to be ready to turn in your apps? Many postings on the wiki list one of two types of date: either a hard deadline, or a softer "review-begins" date. For present purposes, I've collapsed across these different categories. The histogram below reveals when most applications are due.
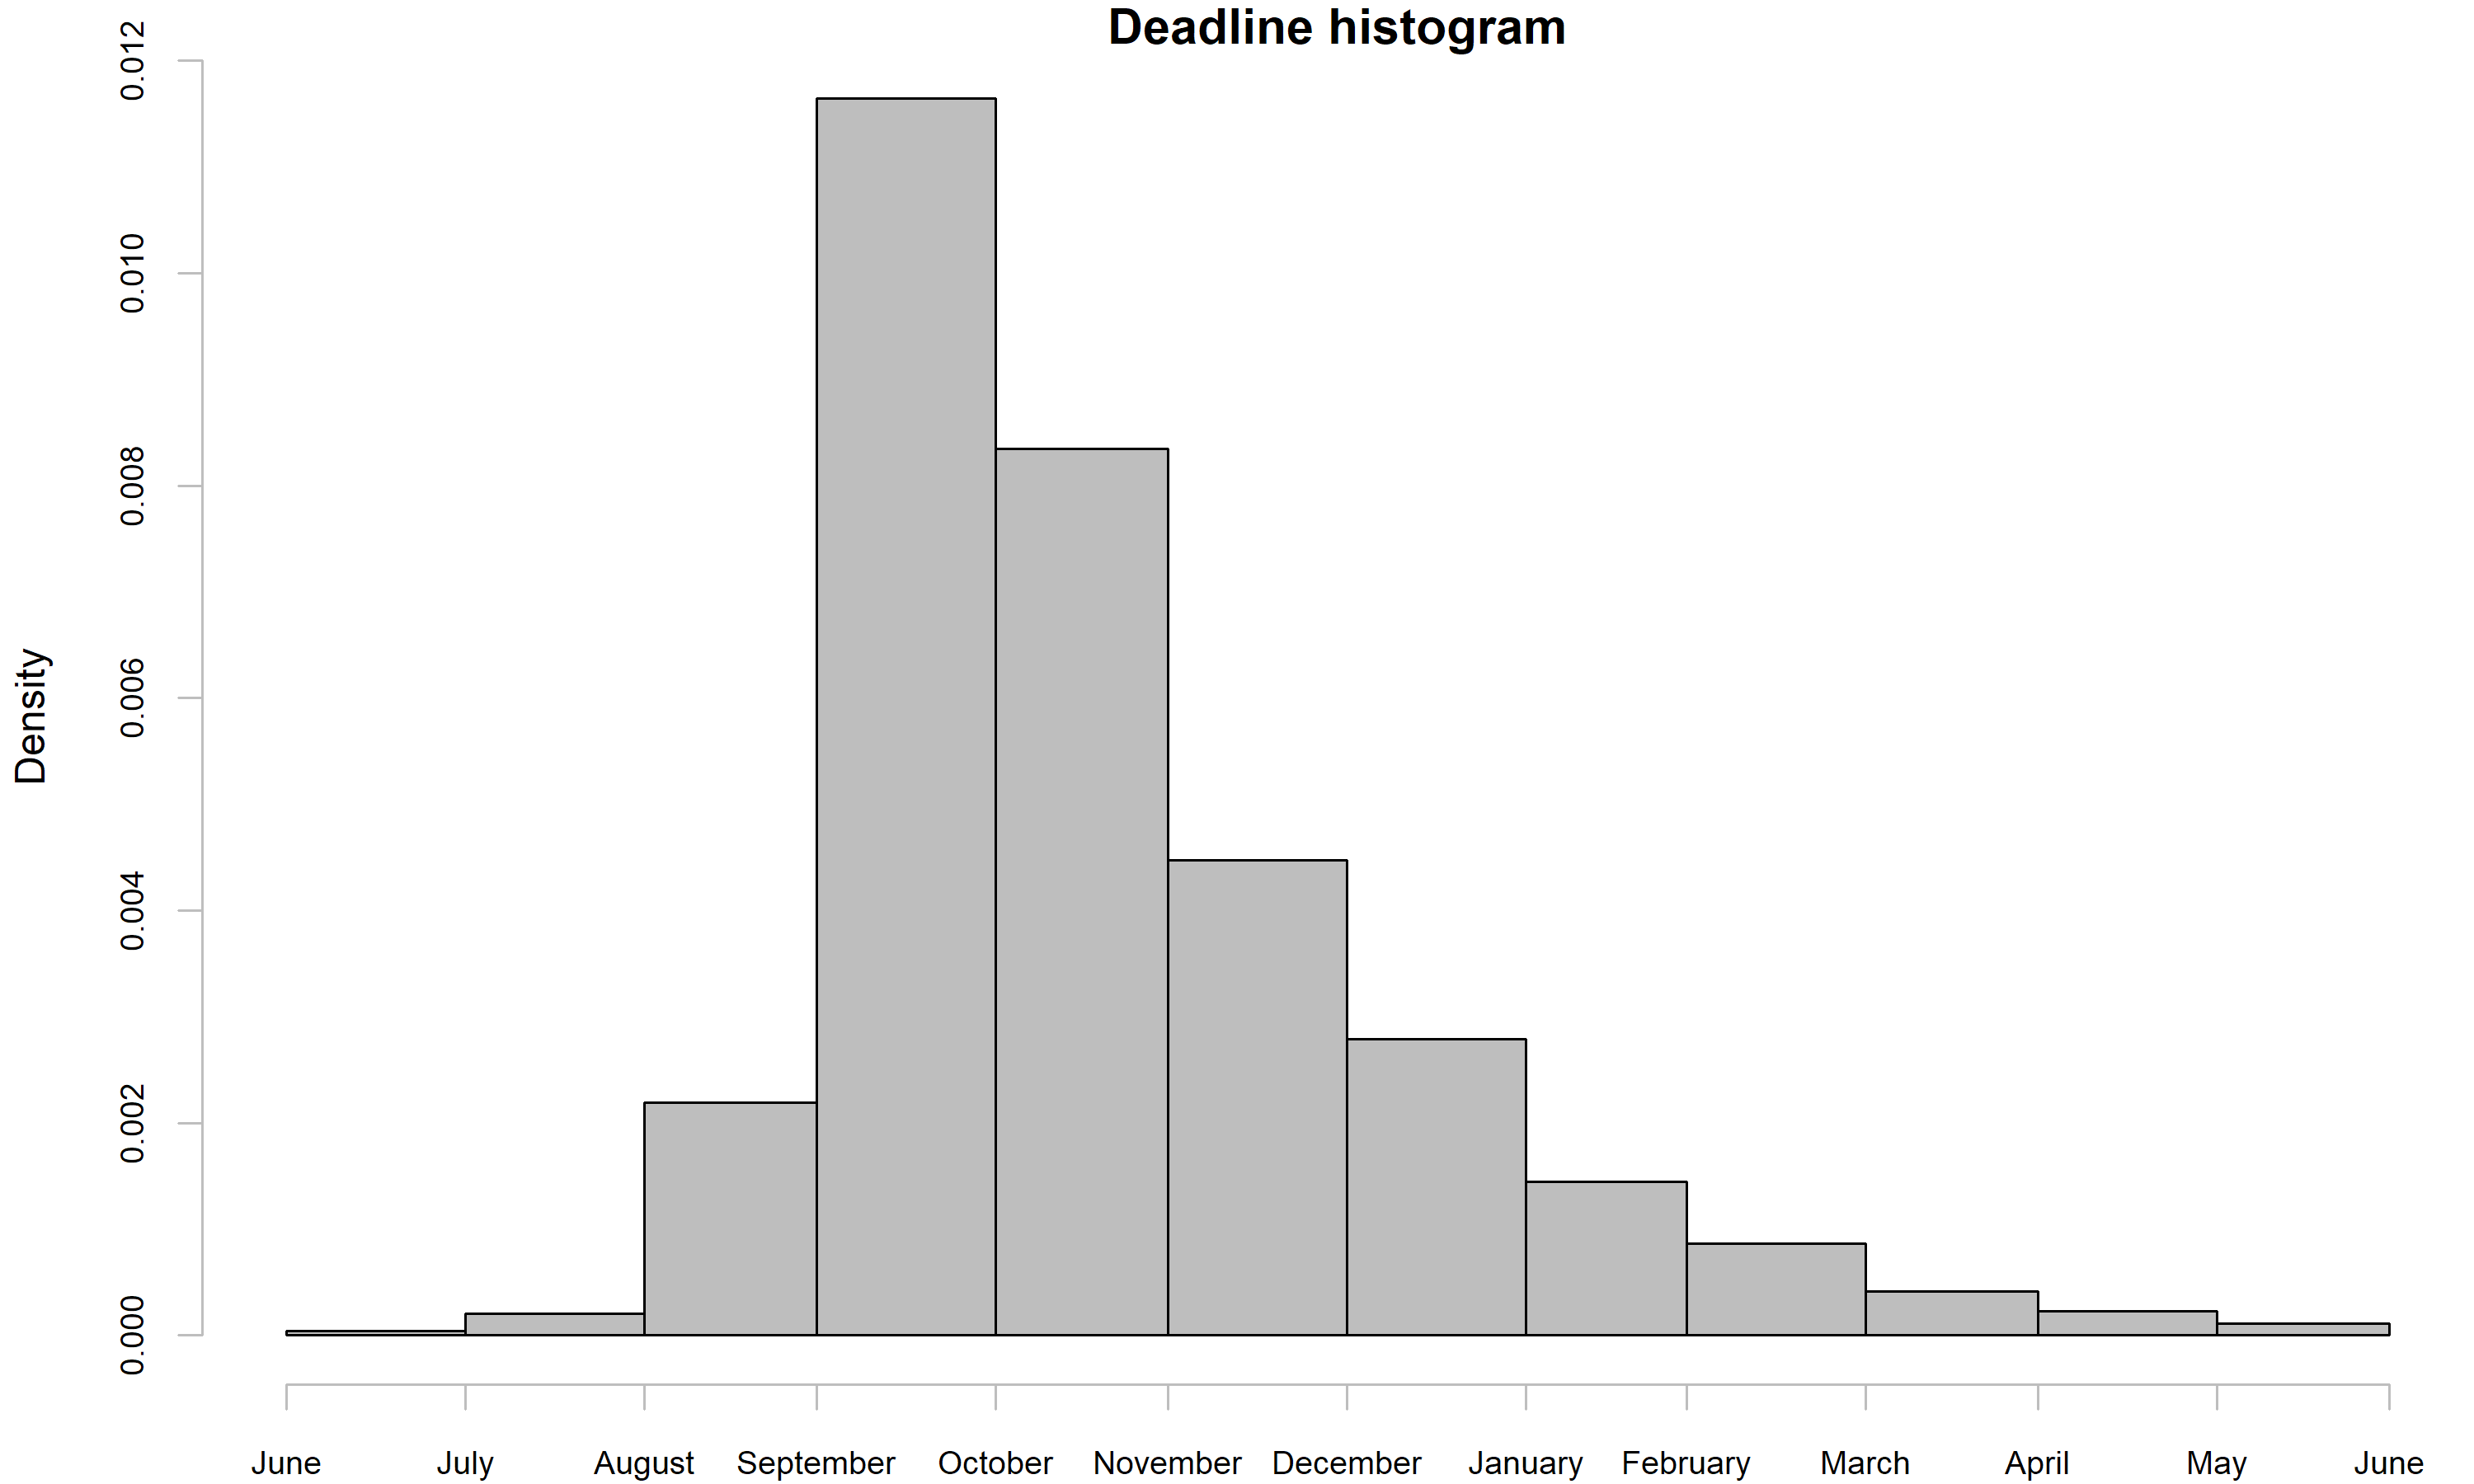
As you can see, most applications start to come due in September. Naturally, you should keep an eye on the wiki, and prepare early if any suitable job pops up with an earlier deadline, but at this point in the year, with very few jobs posted, you can probably be safe just by planning to have your materials ready to send in by the end of August.
There are a number of other dates which might be informative, such as when most jobs are posted, or when interview notices tend to go out. Unfortunately, these are a bit trickier to deal with given the data from the wiki. Posting dates are not part of the job postings themselves. Notionally this information could be extracted from the history of edits to the wiki, but unfortunately its more difficult to programmatically scrape this (raw HTML scraping doesn't seem feasible). As for interview dates, these are sometimes provided by good Samaritans who make it that far in the process, but reporting is highly inconsistent. The biggest problem here is actually the formatting though, which can differ greatly from post to post, making it tiresome to parse this information from the text. The raw data is available, of course, if you want to give it a go yourself!
Conclusion
In this post, we've used data from the PsychJobSearch Wiki to explore the psychology job market. In doing so, we've learned that there will probably be about 700 jobs posted this year, with a relatively even division across content areas. We've seen that these content areas cluster into three main branches. We've also seen that about a quarter of (non-applied) jobs are interdisciplinary, open to individuals in one or more content area. We have also observed that the great majority of postings are for assistant professorships, and that the jobs are roughly evenly split between research and non-research institutions. Finally, we learned that the majority of applications are due in the September-November range. Whether you're going on the job market this year or not, I hope that you've taken away some useful knowledge to help guide your career!

© 2018 Mark Allen Thornton. All rights reserved.