Postings on science, wine, and the mind, among other things.
The Changing Words of Wine
Quantifying changes in back label wine descriptor frequency over the past two decades
People have made and consumed wine since at least the dawn of civilization. However, despite its antiquity, changing times still alter our preferences for wine on an ongoing basis. Fashions rise and fall in the oenological sphere much as they do in music, art, or other aspects of popular culture. Our growing technical ability to measure and guide the growth of grapes and fermentation of wine has only expanded the range of styles the cultural zeitgeist might favor. While we might each have a sense for such changes, our personal perspectives are intrinsically limited by incomplete information and the bias of what we would like to see transpire. Thus this post will continue my previous investigations of wine back label descriptors, moving beyond quality and price to investigate a new dimension: time.
As in the previous posts, I will use data from wine.com to elucidate trends in the use of back label (or strictly speaking, online) descriptors. In the present case I will be considering the listings of nearly 65,000 wines from the 1997 to 2014 vintages. Using R, I searched through the text of the online descriptions of each wine, searching for any of 575 descriptors. I eliminated any wines without descriptors. After splitting the wines into reds and whites, I also eliminated any descriptors that did not occur in at least one listing for each of the 18 vintages in question. For each remaining descriptor, I then calculated the proportion of listing which featured that descriptor in each year. The interactive graphs below, rendered using d3.js, visualize the frequencies of the descriptors for red and white wine over time. The y-axes of these plots indicate the proportion of listed wines that contained the descriptor in question. A few interesting case are already plotted - use the search bar to investigate others!
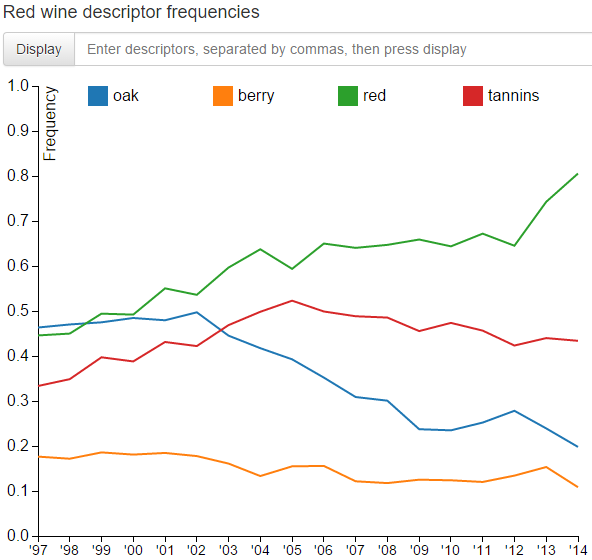
Red wine descriptor frequencies
As you will no doubt discover, many of the descriptors occur in a relatively small proportion of wines. This is understandable: there's only so much room on the back label, and many descriptors are a least partially redundant. However, these low frequencies can be deceptive. Try using the checkboxes at the top of the graphs to adjust the y-axis relative to the data. This can make it much easier to spot trends in lower frequency descriptors. The term "violet" is a good example - what looks like a modest upward trend at best on the unadjusted graph is revealed to be a 4-fold increase in the adjusted version! However, be cautious of extreme low-frequency descriptors - even with the adjusted graph, noise makes trends for these terms dubious. If you see a very jagged line, it probably has more to do with statistical noise than with any real change in wine over time.
White wine descriptor frequencies
A few descriptors with interesting patterns over time are again provided by default. The number of red and white descriptors retained by the method described above is surprisingly similar: 236 for red and 207 for white. This suggests that the substantial differences between red and white wines, winemaker's oenological vocabulary is almost equally rich for each category.
Caveats and correlates
A few cautions worth voicing about the interpretation of the data presented above: one important issue not addressed is aging. Wines naturally undergo chemical changes as they age. Some of these are positive, such as the polymerization (softening) of tannins, while other are negative, such as oxidation. It is unclear from the data obtainable through wine.com whether descriptions of wines have been changed by their producers as time goes on. While I doubt this was happening in sufficient quantity to fully determine results, comparing descriptions of older and younger wines could have exerted some bias on the outcomes. This is particularly true for the last few vintages, where some wines (those meant to age) may not even have been listed yet.
Naturally, it's also worth pointing out the imperfect nature of the source data as well. The wine.com database is certainly extensive, but by no means exhaustive. The company will of course try to cater to its core customer group, who, for example, are American rather than European. The wines represented in the database will thus not necessarily be perfectly proportional to the state of affairs in the world more generally.
Finally, one ought to consider the potential correlates of the changes evident in the graphs above. One major potential factor which might be associated with such changes is varietal. If the production of wines of certain varietals is changing over the same time period, then one might very reasonably expect concomitant changes in descriptor frequency. The graphs below display changes in varietal frequency over the last two decades, as a share of total listed wines.
Red varietal composition over time

The big story with red varietals appears to be the triumph of Burgundy over Bordeaux. The Burgundy red - Pinot Noir - has increased its listings substantially over the past two decades. This expansion has occurred primarily at the expense of the primary Bordeaux varietals: Cabernet Sauvignon and Merlot. Of course, it's important to bear in mind that the number of wines listed does not necessarily translate directly into tonnage of grapes or liters of wine. It's possible that the quantities of Pinot and Cab have stayed in constant proportion to one another, but that the Pinots have been produced by many small boutique wineries while the Cab tonnage has been consolidated under a few bigger producers.
White varietal composition over time
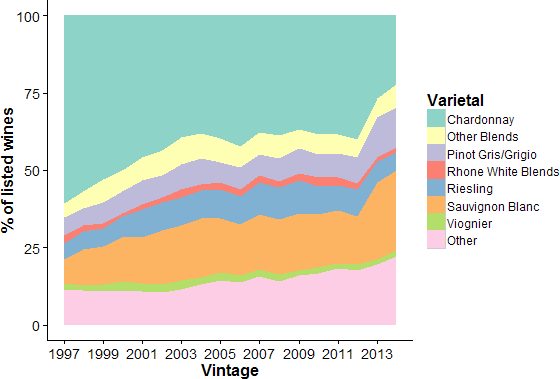
If Burgundy has been successful in reds, its characteristic white have suffered in contrast. The major trend in white wine has been the decline of Chardonnay, largely at the expense of Sauvignon Blanc, among other varietals. Of course one must remember that these trends are probably being driven more by planting in the New World than by revolution in the Old World. Sauvignon has been terrifically successful in many New World locales, from Sonoma to New Zealand to South Africa.
The Fall of the House of Oak
Perhaps the most pronounced trend to emerge from the descriptor and varietal frequency data is the decline of prominent oak influence. Amongst both red and white wines, oak and oak-related descriptors have declined dramatically over the past 18 years. This is also reflected in the decline in varietals which have traditionally been heavily oaked such as Cabernet Sauvignon and Chardonnay. This tendency may indicate a retreat from the bold 'Californian'-style wines of the 90s and early 2000s, which featured powerful fruit and oak influences, into a more subtle style in the current era. Only time will tell what we can expect from future wines!
See the next post in my series on wine here.

© 2016 Mark Allen Thornton. All rights reserved.