Postings on science, wine, and the mind, among other things.
fMRI and correlation attenuation
Why choosing reliable voxels may seem biased, but really isn't
In my most recent neuroimaging research, I'm using feature space modelling in the style of work by Tom Mitchell's lab at Carnegie Melon. Mitchell et al. modelled the neural encoding of nouns using the nouns' associations with select verbs as a basis set of features. Given that my own interests run towards social cognition, naturally I'm doing something a little different. In particular, I'm using the technique to compare different theories of person perception in terms of their ability to predict patterns of brain activity associated with well-known people.
While giving a talk on this research, there was some concern regarding an important step in the analytic process: choosing which voxels to include in subsequent modelling, an operation known as feature selection. There are variety of accepted ways for performing feature selection such as using anatomical regions of interest (ROIs), independent functional localizers, or orthogonal ANOVAs on task data, to name but a few. The method we used was based on reliability. This choice has been closely paired with feature space modelling, going back to Mitchell et al.'s original work (there called "stability"). The particular instantiation I used came to me by way of one my dissertation committee members, Talia Konkle.
I'll spare you some of the particulars, but essentially this process proceeded as follows: first, I generated a wholebrain map of (univariate) split-half reliability with respect to the conditions in the experiment (i.e., 60 well-known people). Second, I thresholded that map at closely spaced intervals between 0 and the maximum voxelwise reliability in the map. At each threshold I would calculate the split-half reliability of pattern similarity across the retained voxels. Finally, I selected the voxelwise reliability threshold that produced the highest pattern-wise reliability and used this to determine which voxels would be included in the feature space modelling. The results of this process can be seen below on the left medial surface of the brain.
Reliability-based feature selection results
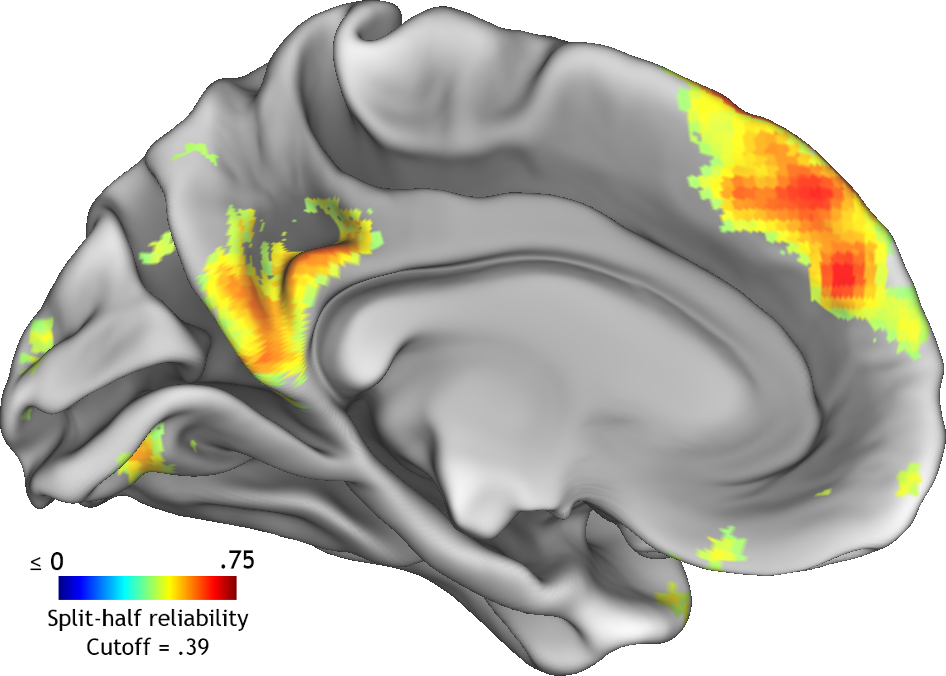
Note the resemblance between these regions and those frequently implicated in social cognition, including medial prefrontal and parietal cortices.
During the aforementioned talk, the feature selection didn't initially occasion concern. However, when I got to the results of the feature space modelling, the audience was surprised by the accuracy of the classification results (close to 80% with our best model, with chance at 50%). There are a number of reasons why we get higher accuracy in this study then in many multivoxel pattern analyses (MVPA), but they're not really germane at present. The worrisome possibility was that the feature selection had somehow introduced a statistical bias into the proceedings.
Most neuroimaging researchers know of the notorious work of Ed Vul and colleagues on "Voodoo correlations" in fMRI research. In a survey of the emotion, personality, and social cognition neuroimaging literature, they found evidence that a substantial proportion of studies used nonindependent ROI/voxel selection when estimating the magnitude of relationships. A nonindependent test uses a certain criterion to pick voxels, and then tests whether that criterion is present within those voxels. For example, one might pick voxels based on having a high correlation with extraversion and then test the strength of the relationship between those voxels' activity and extraversion. The resulting test will yield biased p-values and effect sizes, possibly even detecting a significant relationship where none exists. I have no desire to re-hash all the controversy surrounding this issue, but I think most researchers would now agree that nonindependent tests are bad. If you want to learn more about the "dangers of double dipping," try starting here.
I was fairly confident that choosing voxels based on reliability was not a case of this biasing nonindependence because the distribution of accuracies from permuted models was nicely centered around 50%. However, after my talk I wanted to work out precisely why the method seemed like it might be biased. The rest of this posts explores this topic using a simplified simulation.
Demonstration by simulation
While I was using rather complex feature space models in my neuroimaging work, the much more basic case of bivariate correlation will serve to illustrate the essential points. In the following simulations I generate pairs of variables: an X and a Y. You can consider X to be our explanatory model for the data vector Y. We'll stipulate for simplicity that we measure X and Y with perfect reliability and a fixed correlation coefficient between them. However, we'll then add noise to Y to generate 1000 Yis. You can think of each Yi as a (less-than-perfectly-reliable) manifest measure of the latent variable Y. Since Y is in our possession, we can calculate the reliability of each Yi by simply correlating it with Y. We can also calculate the correlation between each Yi and X. Let's see what happens when we select Yis to average into a composite on the basis of either their correlations with Y or their correlations with X.
Paradigmatic nonindependence: R = 0.7
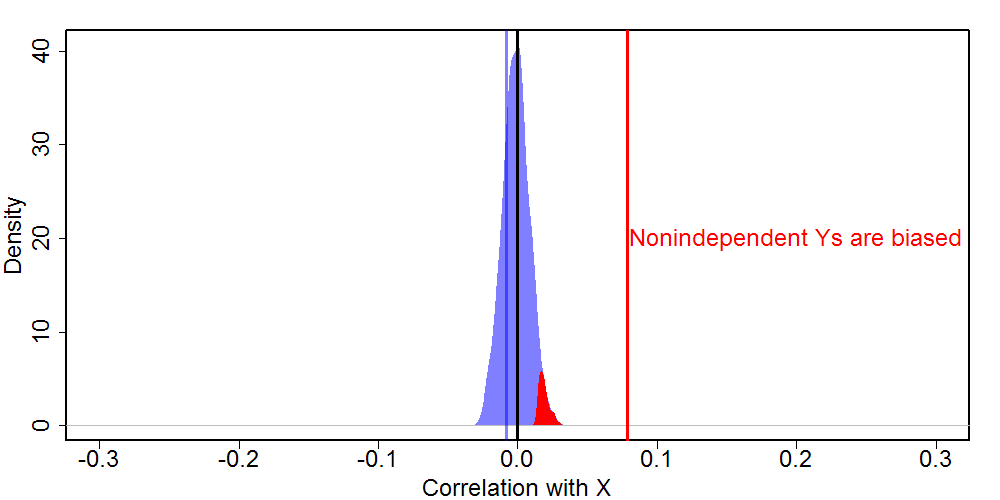
We'll begin with a canonical example of statistically biased double-dipping. In this case, we fix the true correlation between X and Y to 0.7 (a substantial relationship). We'll select the 10 Yis with the highest correlations with X to form our biased composite. We'll also select 10 Yis randomly from the total 1000 to form an unbiased composite for comparison. Finally, we visualize the distributions and correlations between composites as a function of correlation with X.

The nonindependent Yis are clearly just the uppermost end of the distribution of Yis with respect to correlation with X. The effect size estimate from the biased composite (red) exceeds that from the randomly drawn composite (blue), although naturally both composites are more reliable than their components. In this case, the biased composite is ironically actually more accurate about the size of the true correlation with X, but as we'll see, this is a case of being right for the wrong reasons.
Reliability selection: R = 0.7
Now let's compare nonindependence to reliability-based variable selection. The true correlation will remain at .7, and we'll still draw a random composite, but this time we'll generate a composite of interest by taking the 10 most reliable Yis.

This looks potentially problematic. Like in the nonindependent case, the correlation between the reliability-based composite and X is higher than the correlation between the random composite and X. Although the distribution of reliable Yis is more symmetric, it is also still clearly not centered on the larger distribution, suggesting that perhaps we are indeed (inadvertently) performing a biased selection procedure. This example embodies the intuition that might easily lead one to think that reliability cannot be used to select voxels in a feature space model. However, now let's consider a slight variant on the two examples we've just seen.
Paradigmatic nonindependence: R = 0
In this case, we'll repeat the first simulation above, but setting the correlation between X and Y to 0 (i.e. no relationship).
Here we see an even more dramatic example of the problem with nonindependent variable selection. The true correlation of 0 is accurately reflected by the random composite, but the biased composite produces a much larger correlation with X. X and Y both consist of 10,000 observations, so in this case the biased composite is wildly significant (and the correlation with random composite is not).
Reliability selection: R = 0
In our final version of the simulation, we'll repeat the reliability-based selection, but again set the true correlation between X and Y to 0. If this case produces similar results to the last example then the jig is up for reliability-based selection!

However, the results are different. The reliable composite and the random composite are almost identical, and neither differ substantially from the true correlation. It appears that unlike double-dipping, choosing reliable variables cannot conjure a relationship where none exists. That answers one question, but raises another: why does choosing reliable variables increase the effect size in the presence of a non-zero relationship?
Correlation attenuation
The answer to this new question is an old one. The correlation between two variables is partially deteremined by the reliability with which those variables are measured. The more measurement error there is, the weaker the correlation will be. The original proof of this fact, and a way to disattenuate affected correlations, date back to the work of Spearman (1904). Thus, an increase in the reliability of a measure will tend to produce an increase in effect size when a true relationship is present, but will not produce a spurious correlation where none exists. This fact is illustrated below.

As you can see, there is a roughly linear relationship between the reliability of variables and the correlation between them. The slope of that relationship increases in magnitude as a function of the magnitude the true correlation. In the asymptotic case where R = 0, the relationship is flat, thus producing no spurious correlation even when variables are measured with high reliability.
Going back to my fMRI research, the reliability of the neural data can be thought of as putting a ceiling on the observable accuracy of the feature space models. When reliability increases, the ceiling goes up. The models that actually work are free to increase their accuracy commensurately, but null models (such as those produced during permutation testing) stay around chance (50%). Thus, far from generating results which are too accurate, reliability-based voxel selection actually produces estimates of accuracy that better approximate the true effectiveness of the feature space models.
Take-home points
There are two major points that one could take away from this:
- When examining the relationship between neural data and some other measure, choosing reliable voxels does not produce statistically biased results. In fact, this practice produces more accurate measures of effect size.
- More attention should be paid to reliability in fMRI research. Since reliability limits the observable correlation between brain and behavior, discussion of such relationships should make reference to reliability to aid interpretation. Additionally, the spatial inhomogeneity of neural signal reliability (as demonstrated in the first figure of this post) could substantially complicate inter-region comparisons of effect size. Researchers who produce wholebrain correlation maps should perhaps consider also producing disattenuated versions.
Edit: based on conversations I've had on this topic, I think I ought to clarify that reliability-based feature selection is not unbiased for every possible analysis. If the independent variable in question is the same as the unit of analysis over which you calculate reliability, then the results will inevitably be biased. Thus if one conducted a typical MVPA classification analysis in which the experimental conditions were the levels of the independent variable, the accuracy would be artificially inflated. However, in cases such as representational similarity analysis or feature space modelling, where some theoretical dimensions intercede between conditions and the dependent (neural) data, relability-based feature selection provides an unbiased and minimially-noise-deflated estimate of model fit. See below for an additional simulation more closely paralleling feature space modelling that demonstrates that random and reliability based feature selection will both produce chance accuracy in a "pure noise" brain.

© 2015 Mark Allen Thornton. All rights reserved.