Postings on science, wine, and the mind, among other things.
Effect sizes from representational similarity analysis are too small
A demonstration of the quadratic relationship between dimension correlations and distance matrix correlations
Representational similarity analysis (RSA) is an increasingly popular technique for analyzing data from functional magnetic imaging (fMRI) experiments. Its basic idea is to compare how similar things (e.g. visual objects, linguistic utterances, other people) are in terms of patterns of brain activity they elicit, and then correlate this similarity with predictions from a theory (e.g. a computational model, another brain region, behaviors elicited). Due to the focus on fine grained patterns of activity, RSA can be considered a form of multivoxel pattern analysis (MVPA) alongside other techniques such as classification. Although correlation-based analysis is actually the oldest form of MVPA, RSA-proper originated with the work of Kriegeskorte, Mur and Bandettini (2008). The manifest potential of the approach has occasioned considerable excitement, but RSA's novelty means we still have a lot to learn about its functional characteristics.
Over the past several years I've been using RSA to study the neural organization of social knowledge. In the tradition of Kriegeskorte et al.'s work, I've been using condition-rich designs in which participants think about large sets of social stimuli (primarily other's traits and mental states, but see here for an earlier blog post in which I model pattern similarity as a function of Bacon Number). A major goal of this work has been to establish which dimensions account for the most variance in the social domain. For example, are the dimensions of warmth and competence from the Stereotype Content Model better at distinguishing neural responses to thinking about famous people than the Big 5 personality traits? (The provisional answer seems to be yes, by the way.) It was in the course of this research that I discovered the following mathematical quirk regarding RSA effect size estimates.
A fundamental step in any application of RSA is the correlation of (dis)similarity (i.e. distance) matrices. Typically, one matrix is derived from neural data and the other from a theory. For example, we could calculate the neural similarity of representations of famous people by cross-correlating the patterns associated with thinking about them. Participants might then rate each famous person on extraversion, allowing us to calculate a distance matrix by taking the absolute differences between these ratings for each pair of famous people. We could estimate how well extraversion explains pattern similarity by correlating the rating dissimilarity matrix with the neural correlation (distance) matrix, after converting them each into vectors, naturally.
The value of the correlation of the between the neural and theoretical distance matrices provides a measure of effect size or model fit. Nothing is mathematically wrong with this measure, but from an interpretational point of view I have discovered that it can be misleadingly small. If what one is really interested in is modelling (dis)similarities, then it's actually completely fine. However, what one might be interested in when doing RSA is likely to be something subtly different. If we suppose a true set of representational dimensions underlies patterns of neural activity (using dimensions in a very broad sense here), then we are likely to be more interested in how much variance we can explain in these underlying dimensions. Intuitively, I had always thought that the proportion of variance explained in the distances and the proportion of variance explained in the underlying dimensions would be practically identical... until I started playing. As it turns out, the relationship between the correlation of two vectors and the correlation of distance matrices derived from them is actually quadratic, as illustrated in the figure below.
Relationship between vector correlation and distance vector correlation
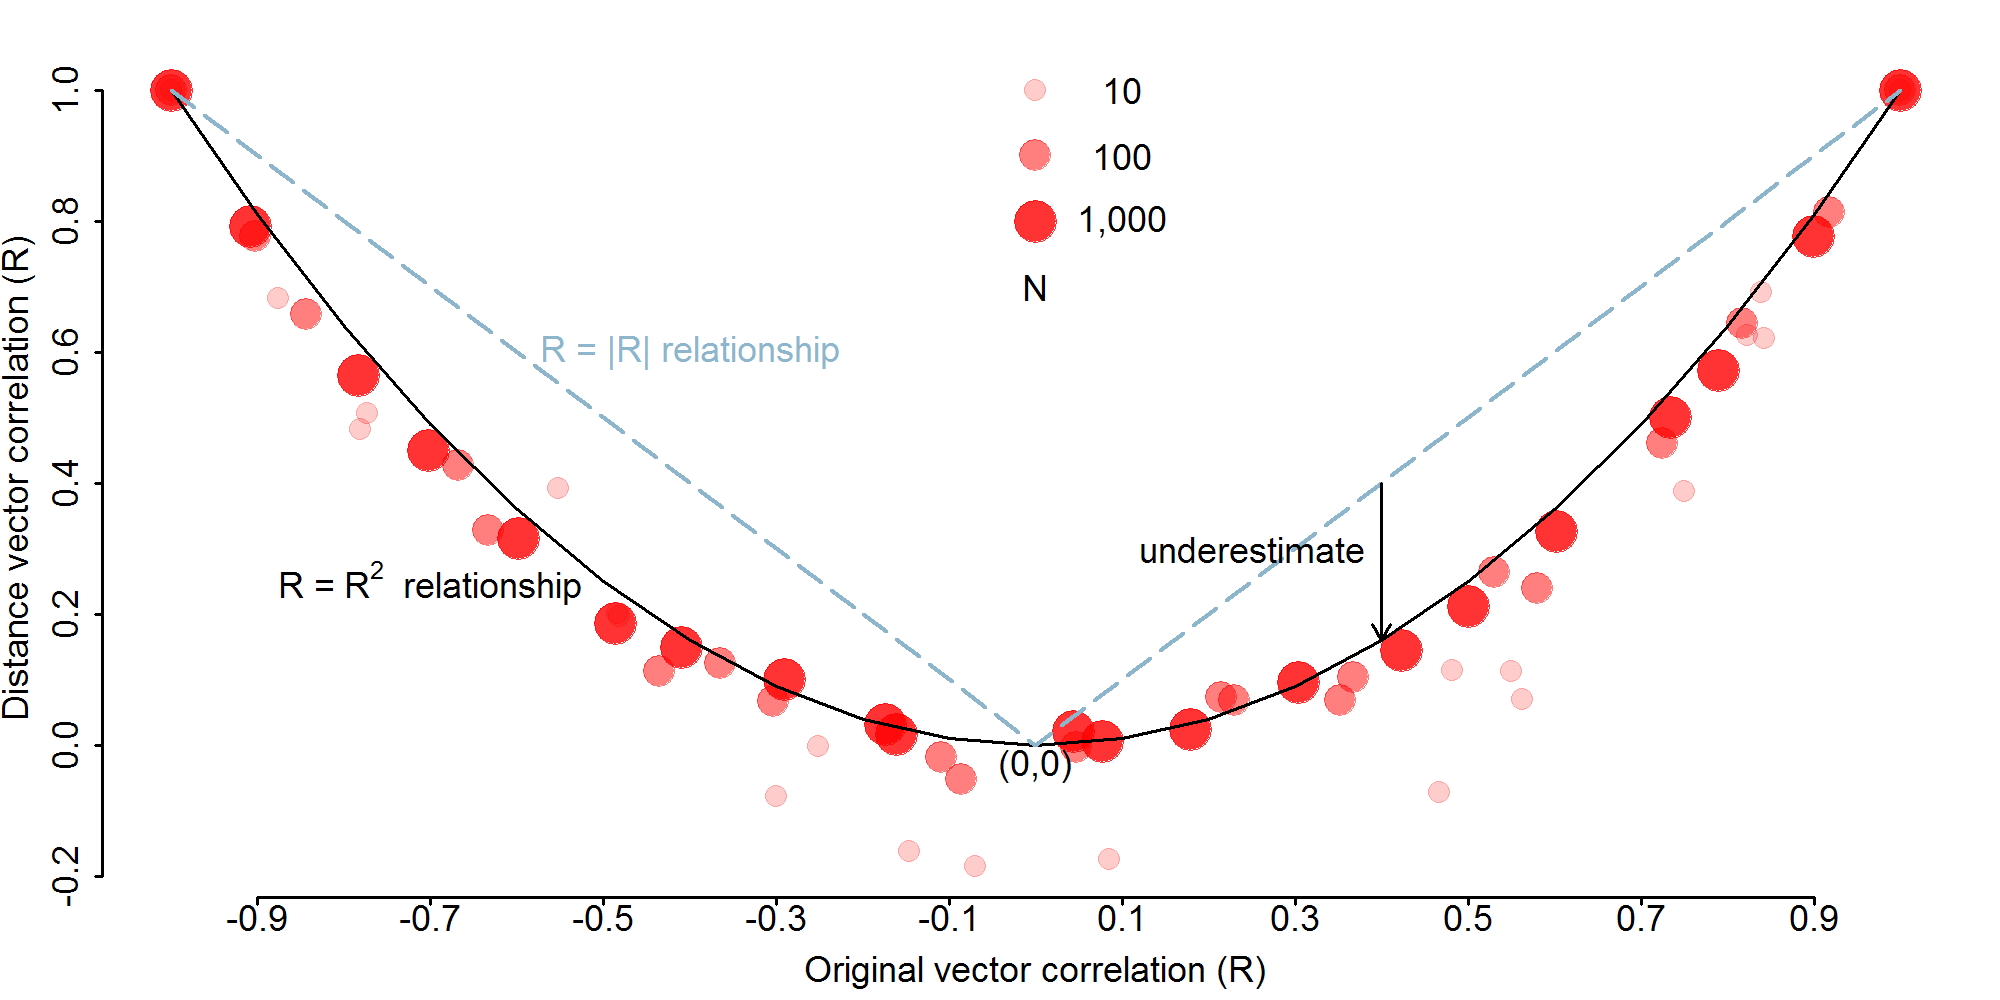
This figure was generated by simulating random normal vectors with predetermined correlations (R=[-1,1]), calculating distance vector for each by taking the absolute difference between each of the values in each vector, and then correlating the resulting distance vectors.
A few salient points:
- The overall U-shape of the graph is not unexpected because the distance conversion essentially discards sign information. However, a direct relationship between the original and distance-converted data would yield a V- rather than U-shape. The gap between the R=|R| and R=R2 lines illustrates this difference and the problematic underestimation.
- The underestimation is all the more pernicious because it is nonlinear, with large differences for middling correlations but small differences for correlations near 0, 1, or -1. Thus, for example, when Kriegeskorte and colleagues found a correlation of R = .49 between human and monkey IT cortex dissimilarity matrices, the dimensions of human object representation might actually have correlated with the dimensions of monkey IT object representation at R = .70.
- "N" here refers not to participant number, but to condition number in the simulated experiment. The quadratic relationship clearly becomes more precise as a function of N, and low N cases even seem to be particularly underestimated. Since even condition-rich fMRI experiments often have fewer than 100 conditions, this tendency is germane and worrisome.
- Although the quadratic relationship is nearly perfect, especially for high N, many more points fall under the U-curve than above it, suggesting some slight additional underestimation of unknown origin.
- While not shown in the figure (check the code), the quadratic underestimation persists under a variety of circumstances. At least within the limited scope of the simulations I've run, it has been
resilient to:
- Higher dimensionality distance matrices (i.e. derived from multiple vectors)
- Distance matrices based on a correlation (vs. Euclidean) distance metric
- Spearman (vs. Pearson) correlation between distance vectors
When I first encountered this issue, I was sure that somebody must have discovered it before (even if not in the context of RSA). However, despite fairly exhaustive searching I have yet to find anything regarding this issue. Of course, this sort of thing often lands itself an abstruse technical name, so if someone knows the magical terms to search for I'd be grateful to learn them. It also seems to me that this quadratic relationship is very likely amenable to formal (rather than merely numerical) proof. I took a crack at this initially, but didn't get very far, alas. If you've got the math to solve it, I'd be very interested to see a proof!
In the meantime, there remains the practical issue of what to do about this underestimation. One possibility would be to simply take the square root of the correlation between your dissimilarity matrices. However, in the absence of a formal proof, and given the slightly imperfect nature of the quadratic relationship, some might object to this practice. Another possibility might be to estimate the true underlying dimensions using a technique like factor analysis or multidimensional scaling. These dimensions could then be directly correlated with the dimensions from the theories you are testing. This approach comes with the concomitant headaches of determining dimension number (and possibly rotation), but at least the results wouldn't have to rely on a so-far nonexistent proof. Of course, using either of these approaches would only be appropriate if the underlying representational dimensions are what you're really interested in. If that's not the case, and you really care about the dis(similarity) matrices for their own sake, then no correction is necessary.
Edit: Thanks to Enrico Glerean for recommending some excellent further reading on the topic of distance matrix correlation (1, 2, 3).

© 2015 Mark Allen Thornton. All rights reserved.