Postings on science, wine, and the mind, among other things.
The Price of Flavor
Data on the co-occurrence and cost of wine descriptors
Wine expresses a richness and variety of flavor almost without parallel. It can evoke the floral sweetness of orange blossoms, the tang of fresh grapefruit, or the puckering astringency of a cup of Earl Grey. Its aromas can carry notes of white pepper, vanilla, or chocolate. It can caress the mouth with a resinous, full-bodied viscosity or sear it with fumes of ethanol. Despite the expansive vocabulary of wine-drinkers, the descriptors applied to wine have structure. Certain flavors tend to appear in unison rather than co-occurring randomly. For example, if I'm told nothing but that a wine has a buttery aroma, I can make an educated guess that it will also have prominent oak characteristics and be right more often than not.
Discovering the precise nature of descriptor co-occurrence will be one of the main goals of this post. The other goal will be associating descriptors with price. In an earlier post I investigated the correlation between the use of certain words in winemaker's notes and professional and community wine ratings. However, in the process I discovered that the correlation between ratings and price is actually quite modest (r = .24 for professional reviews, and r = .25 for consumer reviews). Thus, this post will address the question of whether certain flavors essentially "cost" you more, when they appear on a bottle's back label. Note that throughout this post I use the term "flavor" as a catchall to encompass descriptors which may be based on aroma, taste, visual appearance, or mouthfeel.
For both questions it is important to bear in mind that winemaker's descriptions are part tasting notes and part marketing material. They are hardly likely to say anything negative about the wine in question, and thus may yield a somewhat biased view of the structure of flavor. I would like to be able to work with a large dataset of professional or enthusiast notes, but unfortunately none of the websites I've investigated so far has been willing to share their data. Several people suggested after my last post that I use data from CellarTracker, but I had already looked into this possibility. Unfortunately, due to a malicious scraping incident a few year back, Eric LeVine, who runs the site, is understandably reluctant to share data. So I am once again indebted to the good folks at Wine.com for the data I will use in this post.
Methods
I used Python to access the Wine.com API, collecting winemakers' descriptions and prices for over 75,000 wines. With a little help from the Essential Wine Tasting Guide, I generated a list of 575 potential descriptors. I then counted the occurrence of these descriptors in each wine, eliminating any wine which had none of them. After breaking the dataset into red and white wines, I removed descriptors that did not occur in at least 10% of wines. Note that this might remove some descriptors that are used very heavily for single varietals. To create a network, I connected descriptors with co-occurrence frequencies (normalized by expected value) in the top 10% of potential links. Thus the descriptors that are linked are those that tend to appear together most frequently on the same back labels. Finally, for each descriptor, I rank correlated occurrence frequency with wine price to determine whether it tended to occur on more or less expensive wines' back labels.
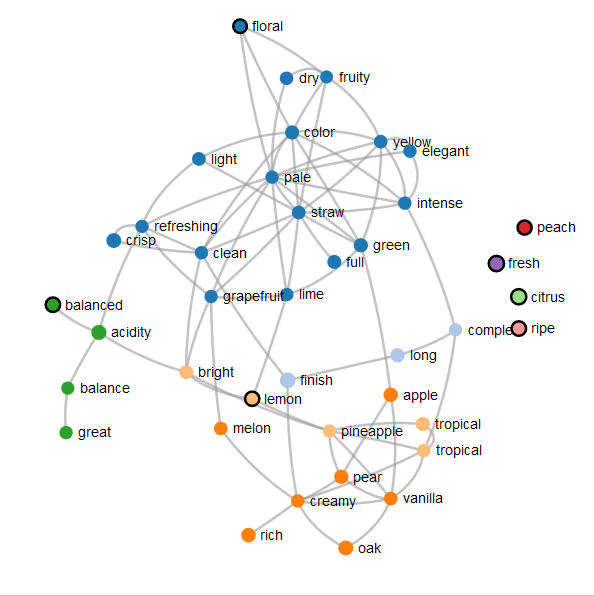
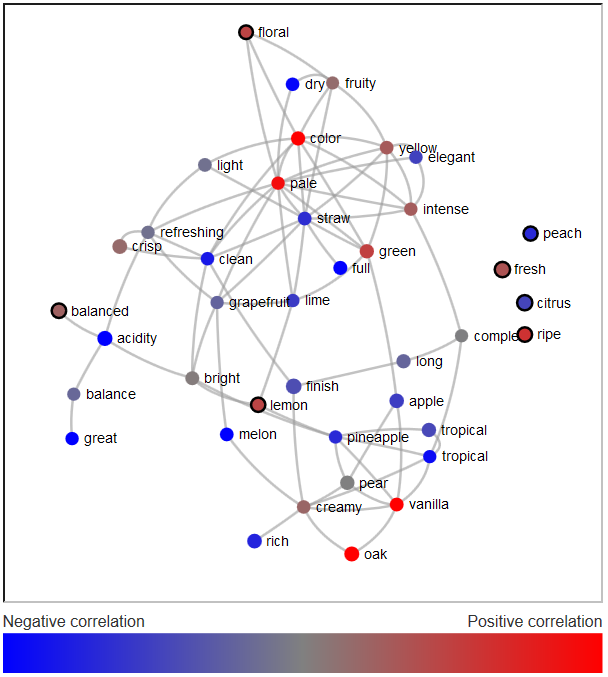
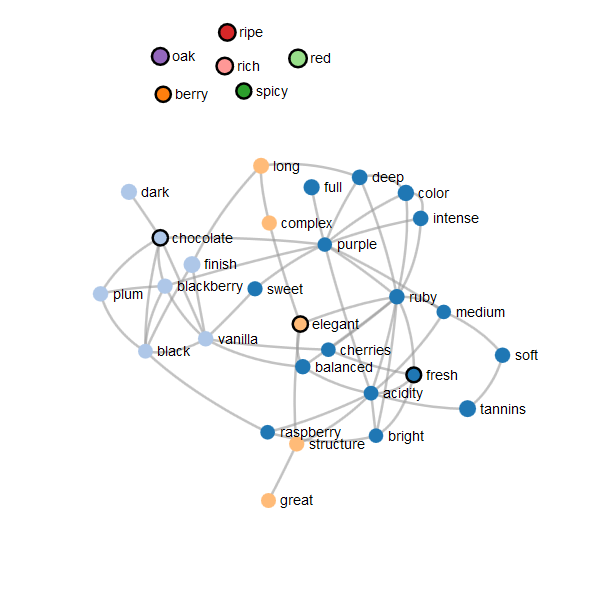
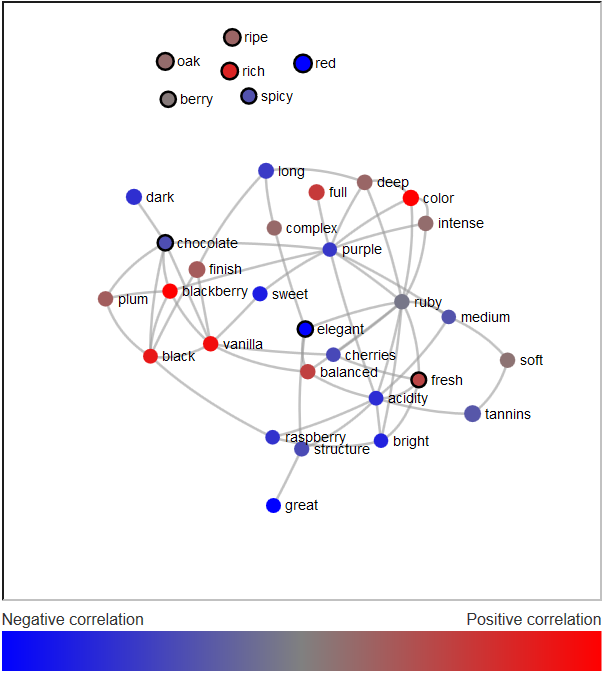
The resulting networks are shown in the interactive figures below. The radius of the nodes (circles) in the network vary with the log (base 10) of the descriptor's frequency. The nodes were colored based on infomap community finding, a clustering algorithm for networks. The colors assigned to the flavor clusters are arbitrary and proximity in color space is not meaningful. The blue to red heatmap indicates the degree to which the presence of each descriptor was negatively or positively correlated with price (on the range r = [-.1,.1]). Statistical analyses were performed in R using the igraph package. The network visualizations were produced using d3.js borrowing from these examples (1, 2, 3).
Results
How to interact with the graphs: clicking on a node will affix it to the background. A black outline will appear around fixed nodes. Nodes can be dragged to different positions to allow for clearer viewing. Double-click on a fixed node to release it. Hover over a link between nodes to darken it and show its path more clearly. Use the buttons below the graph to toggle the color mapping between flavor clusters and price. If you are unable to view the interactive graphs, use the following links to view static images of white wine flavor clusters, white wine flavor prices, red wine flavor clusters, and red wine flavor prices.
White Wine
Four flavor clusters emerge from the network analysis of white wines. In dark orange, we have a cluster centered on "vanilla" and "creamy". The co-occurrence of flavors in this cluster may depend heavily on Chardonnay, given that apple and pear are also prominent descriptors of this varietal. A connected cluster in light orange features tropical fruit and lemon. This may reflect the tropical fruit style of Sauvignon Blanc (as opposed to the more grassy/grapefruit style). In dark green, another cluster is focused entirely on acidity and balance. Finally, the largest cluster (by descriptor number) features a range of different flavors from grapefruit, through more vegetal and floral notes, as well as more abstract descriptors such as "elegant". There were also four unconnected nodes - peach, citrus, ripe, and fresh - which did not tend to co-occur systematically with any other descriptors.
Examining the price correlations, we can see that each of the flavor clusters contains descriptors both positively and negatively correlated with price. Thus, even though some flavors tend to appear together, they actually predict cost in opposite directions. This is good to see, because it suggests that differences are not simply being driven by large-scale flavor profile differences, such as those between varietals. The terms vanilla, oak, pale, and color were consistently associated with more expensive wines, while many terms such as dry, full, straw, clean, acidity, great, and tropical are associated with less expensive wines.
Red Wine
Surprisingly, the red wine flavor network is actually somewhat simpler than that for the white wines. There are three flavor clusters. The light orange cluster reflects nodes related to a wine's "structure." The terms in this cluster are all somewhat abstract, but they may refer to overall mouthfeel and flavor profile. In light blue and dark blue, we see clusters that relate primarily to black and red fruit characteristics, respectively. The black fruit cluster also contains the descriptors of chocolate and vanilla, indicating a relationship between the presence of these fruit flavors and oak influence. The dark blue cluster, centered around "ruby", features a wider variety of terms, ranging from fruit notes (e.g. "raspberry") to soft tannins and acidity. The split between black and red fruit may partially reflect the difference between heavier reds such as Cabernet Sauvignon and lighter reds such as Pinot Noir. Again, there are a number of descriptors that do not link to any others, including spicy, ripe, and rich.
Examining the price correlations, we can see that both the black and red fruit clusters have expensive and inexpensive flavors. Price is most highly correlated with using the terms color, vanilla, black, and blackberry. Acidity, sweet, purple, dark, and red are all associated with less expensive wines. The structure flavor cluster is almost completely associated with lower price wines. This is somewhat puzzling, since complex structure is typically regarded as desirable and expensive. Perhaps more expensive wines simply don't brag about their structure as much as their less expensive brethren?
Conclusion
As we've seen, the descriptors winemaker's use on the back labels of both red and white wines can be reduced to about 3-5 flavor clusters. Although there are nuances in the connections between individual flavors in each cluster, in general this suggests that the macro-structure of wine description is fairly simple. It would be interesting to compare this to other types of food and drink with comparable complexity. If a similar number of clusters emerged, it might suggest that this number reflects a general limitation in the cognitive or sensory systems that support wine tasting.
The associations between various flavors could be quite helpful if you're ever feeling overawed by all of the descriptors someone else is rattling off. If you can positively identify just one aspect of a wine, you can make some good inferences about what other flavors are likely to be there as well. Of course, it would be great to be able to compare the data in the current investigation with more objective tasting notes to see how winemakers may skew the associations when writing about their own wines.
Another piece of good news to emerge from this analysis is the suggestion that regardless of which flavor clusters you prefer, there tend to be more or less expensive wines with a similar profile. Next time you reach for a bottle of red that has "vanilla" on the back label, perhaps you should consider the adjacent bottle with "chocolate" - they probably taste similar, but the later is likely to be more affordable. Of course, all of the correlations between particular descriptors and price are quite modest, so don't count on seeing this relationship with every pair of bottles.
See the next post in my series on wine here.

© 2015 Mark Allen Thornton. All rights reserved.