Postings on science, wine, and the mind, among other things.
Wine Appellation Flavor Map
How close are wine regions in flavor, rather than physical space? Text analysis of Wine.com data reveals the landscape of taste.
If you've ever gone touring in wine country, you've probably seen a "wine map" sitting in the brochure holder of a hotel or visitor's center. If you haven't, the Internet is full of them. These colorful maps partition wine-growing regions into smaller areas called appellations, resulting in geographic mosaics that resemble the Holy Roman Empire at its messiest. Although the rules for what constitute an appellation vary significantly from country to country, vineyards within an appellation typically share features like climate, soil, or history.
Although wine maps like this can help you navigate to a vineyard, they don't help as much to reveal an appellation's most important quality: the flavors of wines produced therein. The information most apparent in a traditional wine map is the geographic location of an appellation - its longitude and latitude. However, these factors only weakly predict the flavor of wine. It is true that Vitis vinifera only grows within a certain latitude band (north or south), but microclimates result in large variability in the temperatures, rainfall, and sunlight one might expect within a given latitude. The unique terroir of an appellation depends on multiple factors, including soil type, elevation, nearby bodies of water, the native microbiological population, and the culture of the people who live there. Moreover, winemakers have marked influence over the product they create, whatever the grapes might be like. Their decisions regarding things like winery sanitation, managing fermentation, and aging induce still more variation that is not inherently geographically determined. As a result, a short drive may sometimes transport you to a world of utterly different wines.
The disconnect between physical space and flavor space inspired me to attempt to create a new type of map. In this flavor map, the distance between appellations would be dictated not by spatial proximity but rather by similarity in taste and aroma. To achieve this, I again turned to data from Wine.com. In the past, I have used this data to explore the relationship between wine quality and winemakers' back label notes, between descriptors and other descriptors (and price), and betweeen descriptor frequency and time, among other things In this case I examined the frequencies of descriptors to determine the similarities between different grape-growing appellations.
Proof of Concept
Before starting, however, I wanted to test my methodology. To do so, I built a map of wine varietals using the same analytic technique I planned to apply to appellations. This technique goes by the name of ordinal multidimensional scaling (MDS). I used an implementation of MDS created by my colleague Patrick Mair and others. MDS is a bit complicated, but the gist of it is as follows: you feed distances (literal physical distances, or any type of dissimilarity measure) between "objects" (cities, books, patterns of brain activity, or even wine appellations) into the algorithm. The MDS algorithm then returns coordinates for those objects in N-dimensions (usually N=2, for visualization reasons) that reproduce the distances between objects as well as possible, given the number of dimensions available.
To calculate the distances between varietals, I simply counted up how many times each of several hundred flavor descriptors was used to describe that varietal in the winemakers' notes from Wine.com. I could then correlate different varietals' sets of descriptors counts to determine how similar they were. Two varietals with very similar descriptors would end up with a high correlation between them. Simply subtracting these correlations from 1 yielded dissimilarities, which I could then enter into the MDS algorithm. The result you can see below.
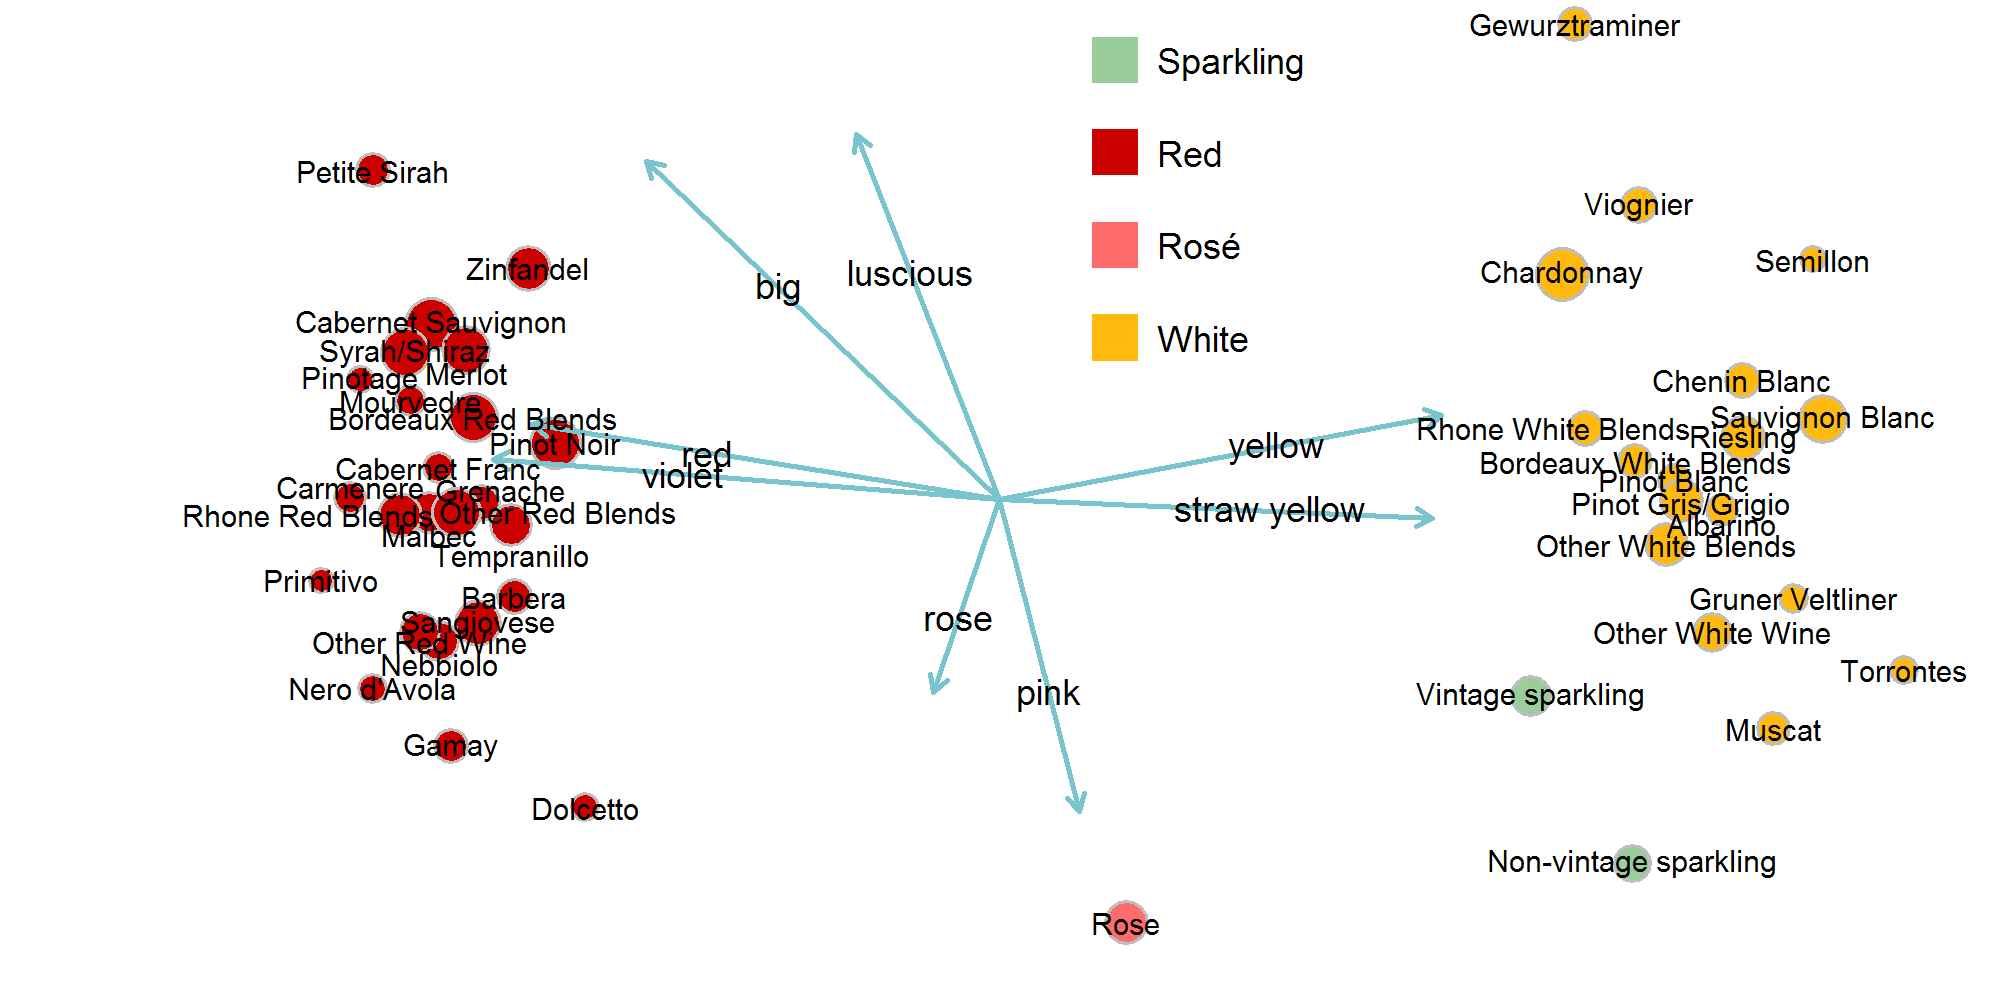
As you can see, the MDS algorithm clearly recovers the distinction between red and white wines from the descriptor text dissimilarities. It even properly places Rosé in the middle! In addition to the color distinction made along the x-dimension above, the y-dimension also captures another quality of the wines. This dimension appears to be something like "body." The arrows you see drawn on the graph are not part of the MDS result itself. In fact, a drawback to MDS is that its axes are not necessarily intrinsically meaningful. If you feed in a set of distances between American cities, the MDS will return a good map of the US, but its "North" could face southeast by the canonical reckoning. The arrows are tools known as biplots which help mitigate this deficiency. They represent the correlation between the axis dimensions of the MDS and other variables we already understand. In this case, they are individual flavor descriptors from our text analysis. The descriptors shown are those with the biggest correlations (positive and negative) with each axis of the graph. They confirm the already obvious color dimension of the x-axis, while making the y-axis easier to interpret. The size of the points is proportional to the number of entries (log10) in Wine.com's database for each varietal.
The Main Event
With the statistical approach validated to my satisfaction, I turned to my main goal of creating an appellation flavor map. The process went exactly as described above, except this time appellations rather than varietals were the "objects" entered into the MDS. I chose dimensions for biplot by selecting a set which had the highest correlations with MDS dimensions, but the lowest correlations with each other. This yielded 5 pseudo-axes which described the map space with minimal redundancy. Again, point size is proportional to the number of wines (log10) from each appellation. Note that the appellations here don't always match up with de jure appellations because some official appellations had too few entries for Wine.com to list them separately. Thus, for instance, the entire country of Austria is a single point despite officially having several distinct appellations. The colors of the points indicate the larger geographical region of each appellation.

Again the MDS of the flavor descriptors yielded some remarkably clear results. Geographically adjacent regions frequently - though not always - appear in close proximity to one another. However, there is remarkable variation within countries, with many appellations more similar to appellations from thousands of miles away than to other appellations within the same nation. Three major clusters seem to emerge: in the top left, a classic "Old-World" cluster; below it and to the right, a "New World" cluster; and arrayed from top-middle to center-right, a third loose cluster, entirely European.
The biplot arrows give us some ideas as to the nature of the third cluster, with color again seemingly the dominant factor. The appellations in this cluster tend to have cool and/or mountains climates, and are particularly known for white rather than red wines. Marlborough (NZ) is the New World appellation which most closely approaches this cluster - indeed, its flavor profile appears more similar to Germany's than to other parts of New Zealand like Central Otago or Hawke's Bay.
The "lime" biplot suggests that citrus flavors - or perhaps fresh fruit notes more generally - are the most distinguishing feature between Old World Wines (excepting regions like Germany) and New World Wines. Interestingly, the South American countries of Argentina and Chile defect from the "New World" cluster and instead cluster with their Iberian cousins in Spain and Portugal.
A major caveat to all this is that these results rely on the back label notes written by the winemakers (or other winery staff) themselves. The notes thus reflect both the flavor actually present in the wine and the winery's marketing efforts. As such, one should perhaps take some of the placements in the flavor map as aspirational rather than realistic. Using unbiased tasting notes would naturally be a better approach, but unfortunately I have no such corpus available to me that rivals Wine.com's in quantity or richness.
Despite this limitation, the text-analysis approach clearly has the ability to reveal known and novel distinctions about wine. Next time you're navigating the aisles of your local wine shop - rather than the back roads of wine country - this flavor analysis is the sort of map you'll want to reach for!

© 2016 Mark Allen Thornton. All rights reserved.